Use IDE: Search And Analysis
The IDE goal is to ease manual assessment and offer the power to write custom checks on top of all the analyses done by Ostorlab, from taint analysis, dynamic call traces, intercepted traffic, and scanned API requests.
Accessing the IDE
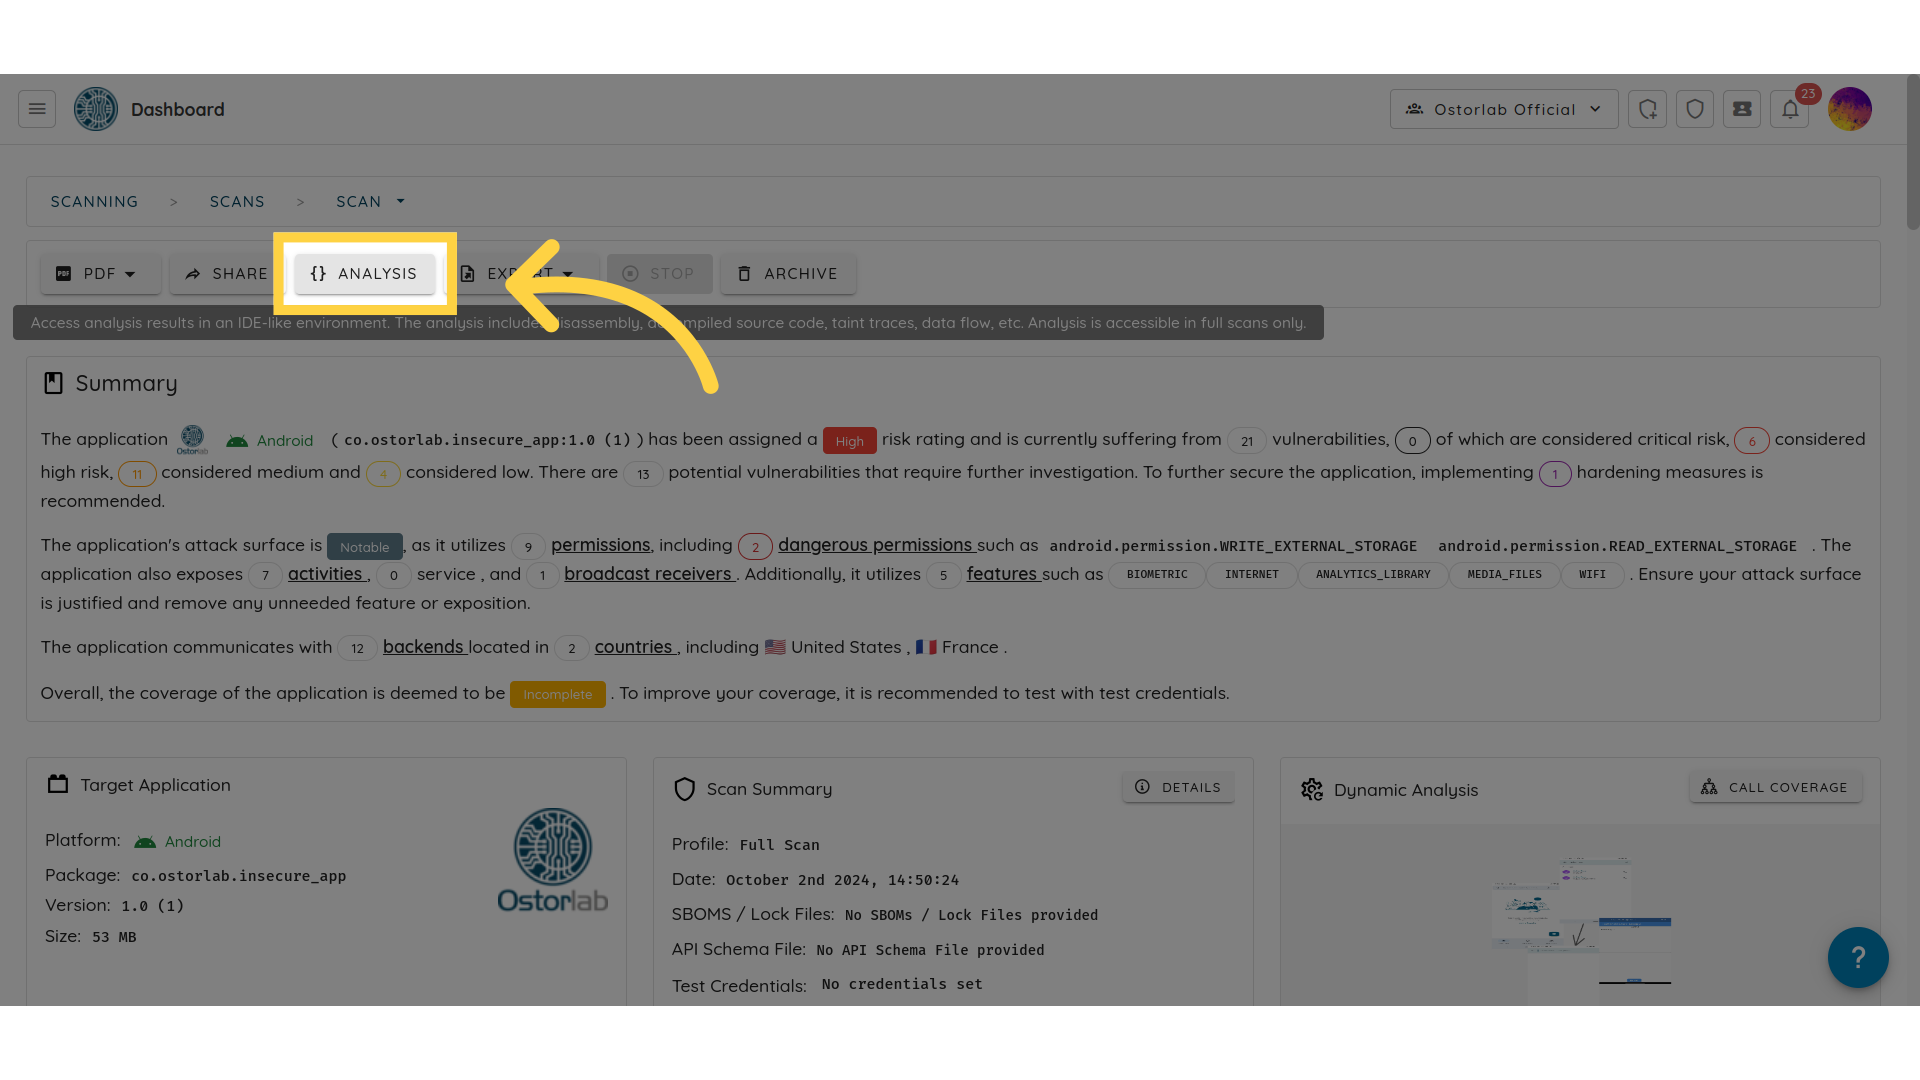
To access the IDE, go to your scan page and click on "analysis."
Navigation
The IDE sections are listed on the left:
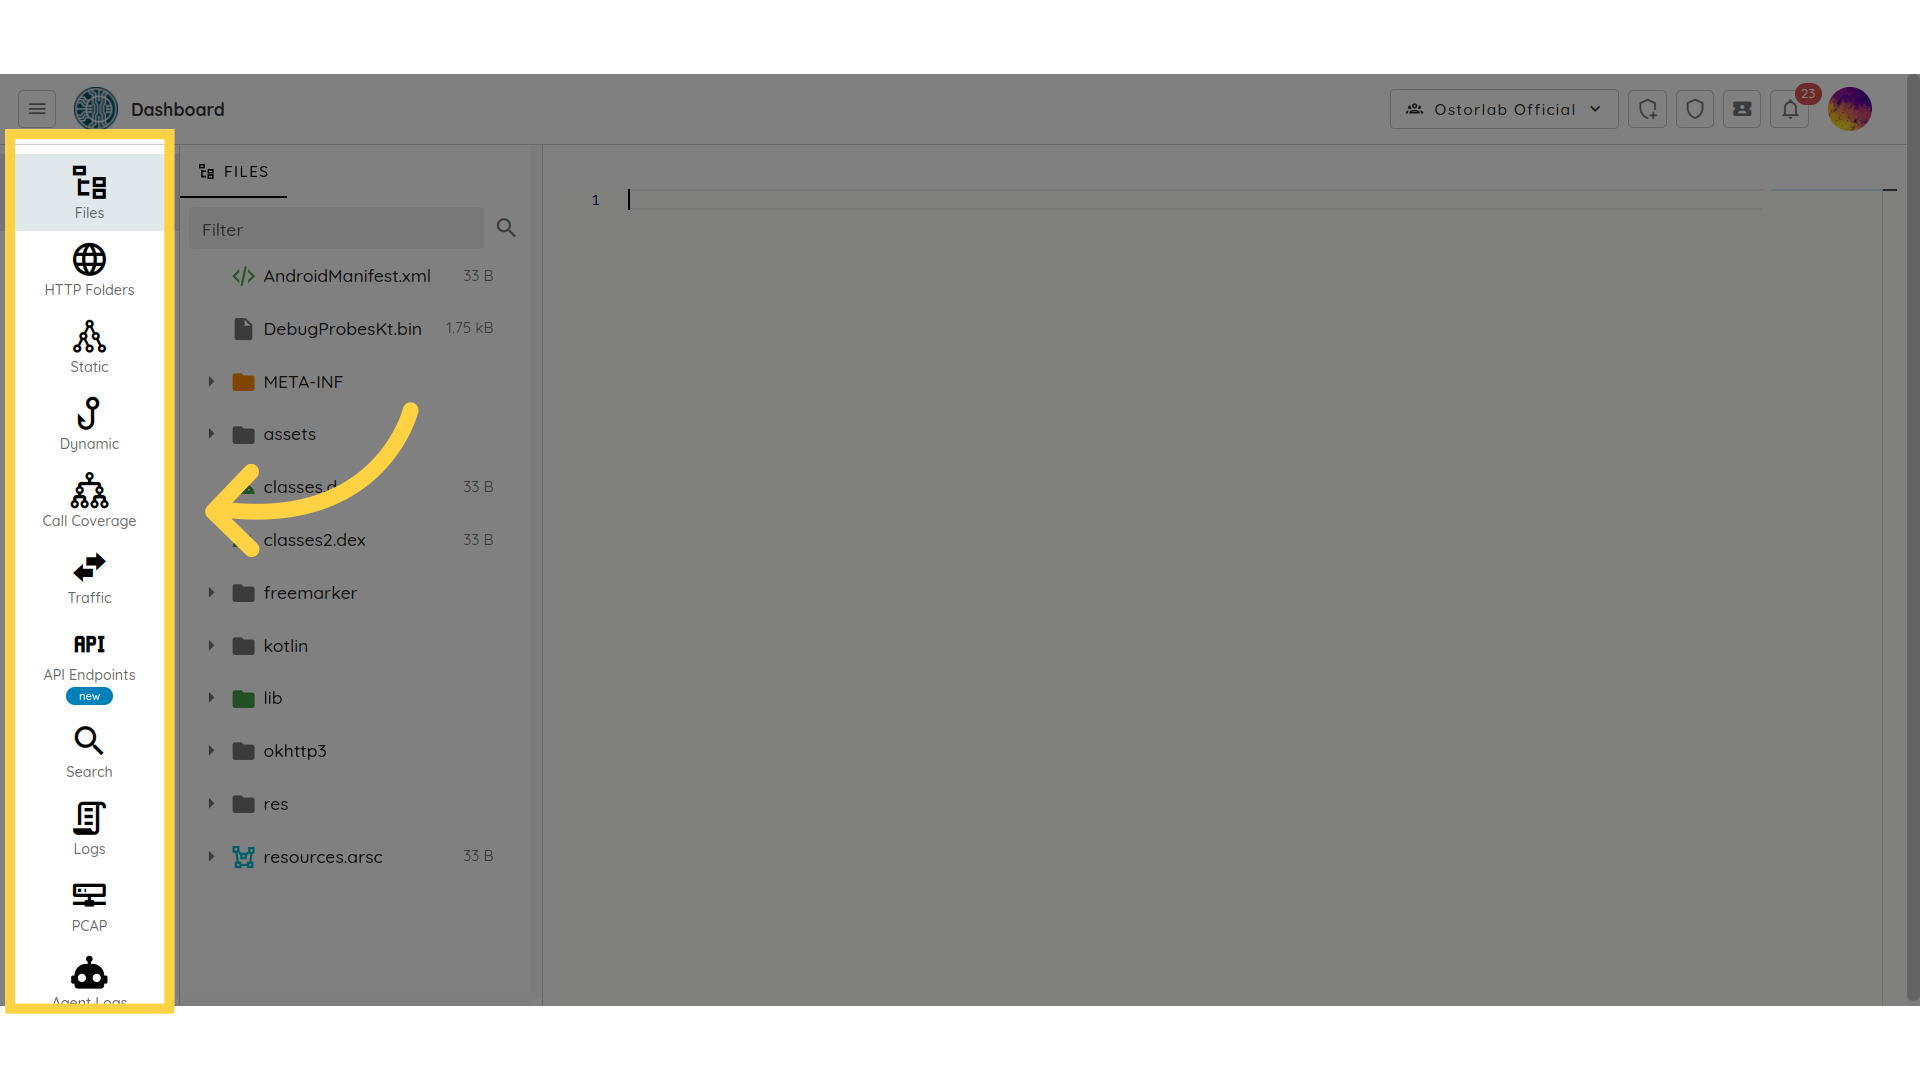
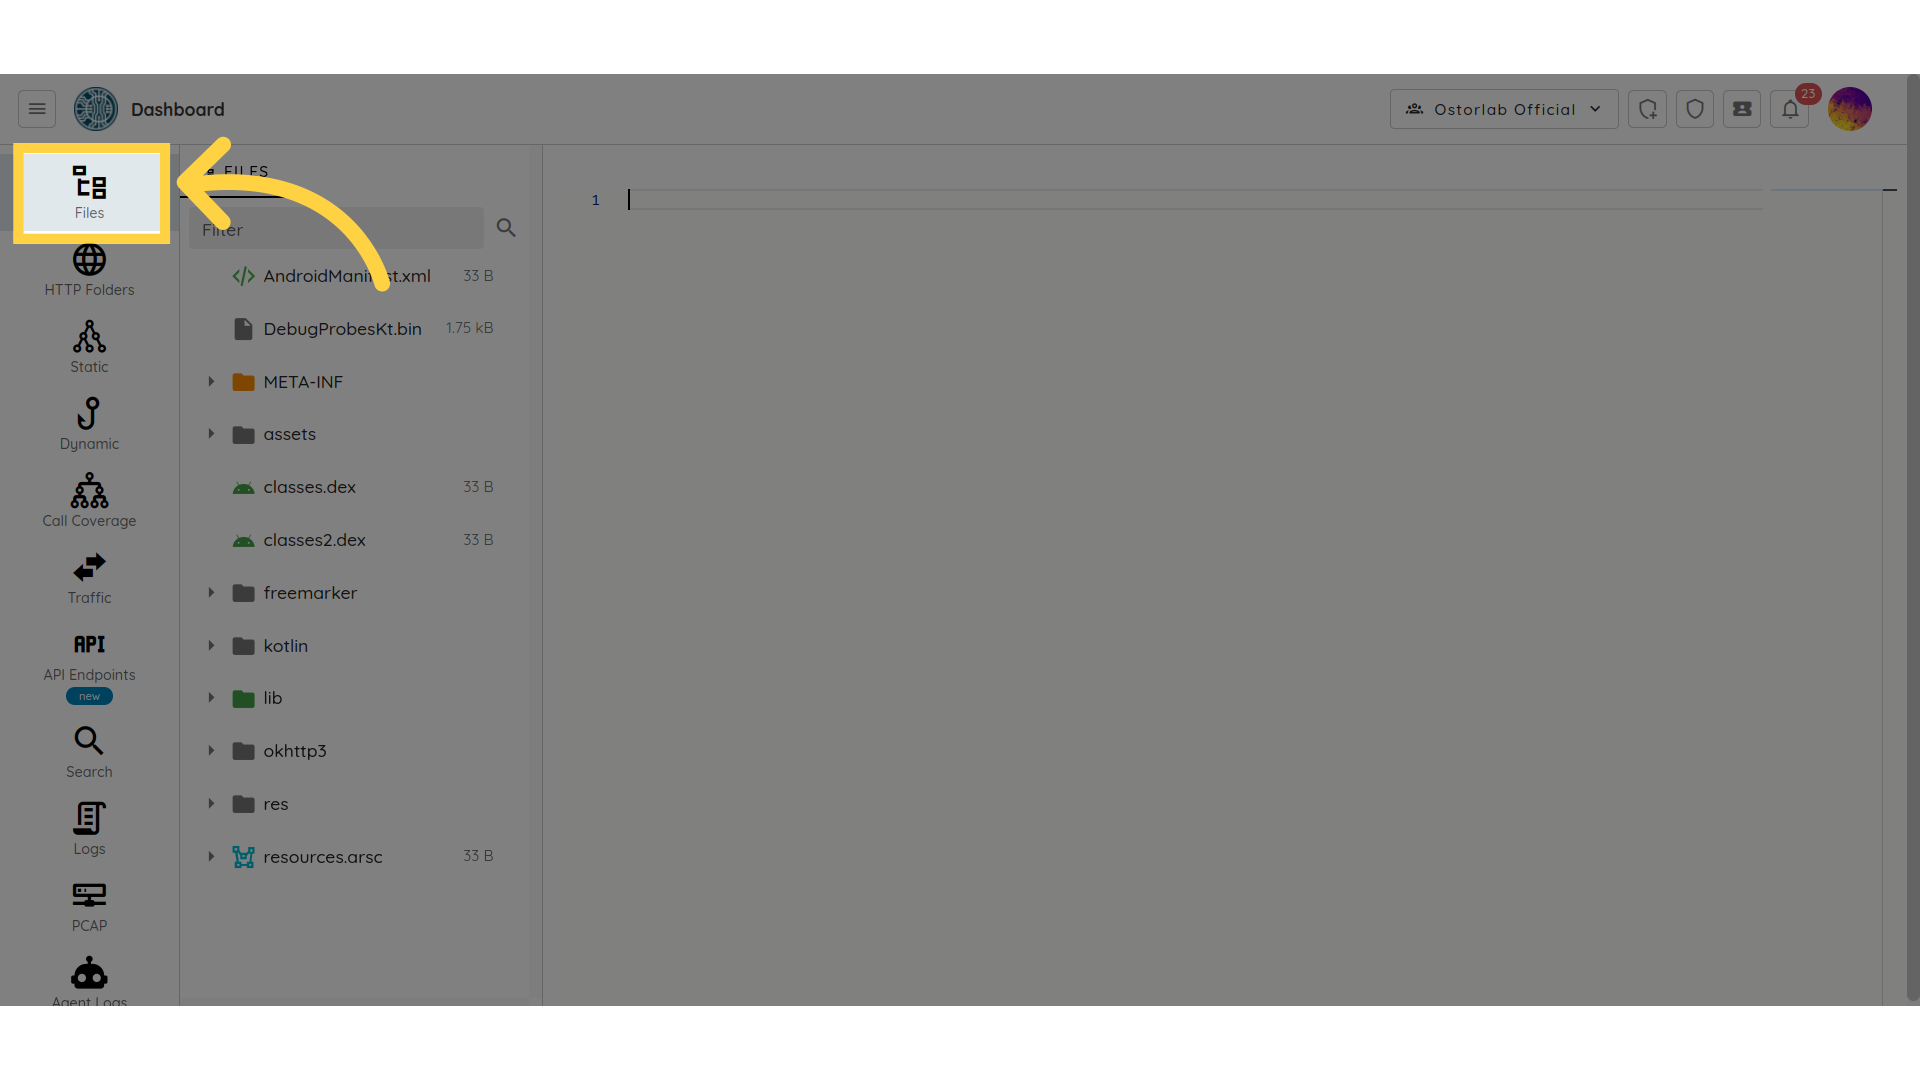
- Files: APK and IPA are the package file formats for Android and iOS mobile apps, respectively. These files contain all the resources and code needed to install and run the app on a mobile device. The "Files" option can help you inspect the contents of the APK or IPA file. You will see a list of files and directories that make up the app. These files may include the app's code, resources such as images and sounds, configuration files, and other assets used by the app.
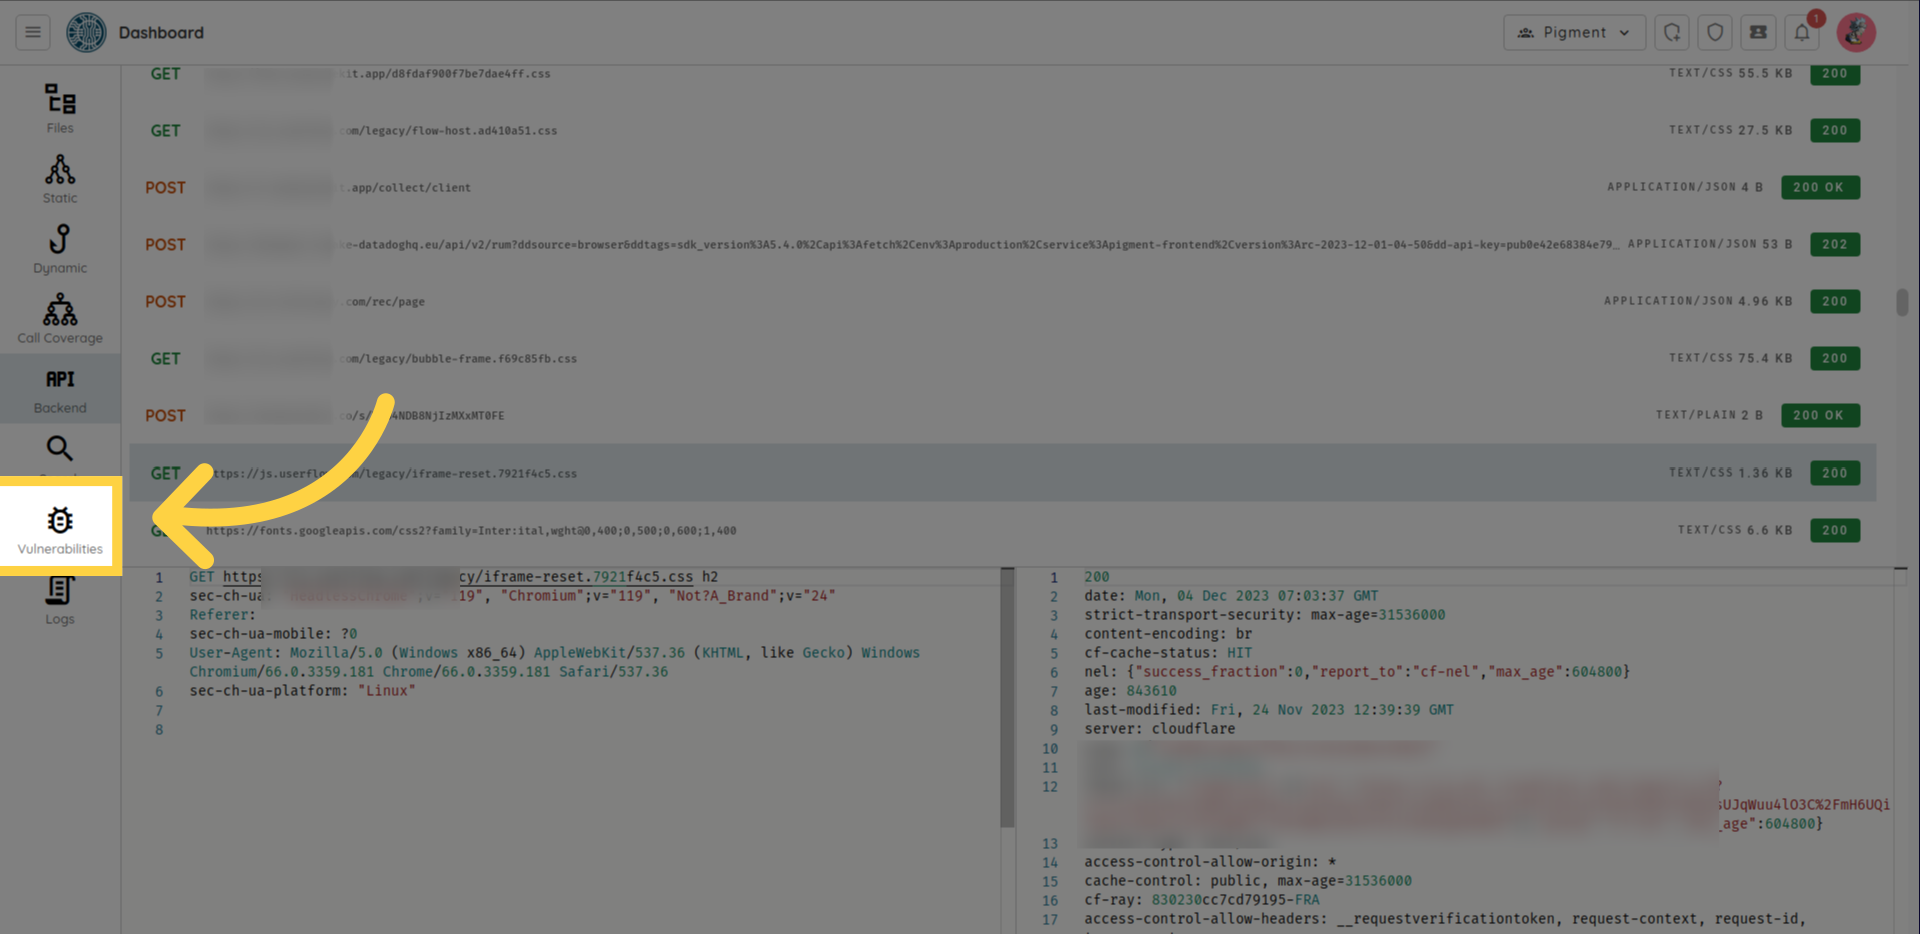
- HTTP Folders: All the collected network traffic sorted and organised by individual endpoint.
- Static: Static analysis navigation is created to help engineers identify potential issues in their code. This can involve reading through the code, examining variable types and functions, and looking for common coding mistakes such as null pointer dereferences, memory leaks, or buffer overflows.
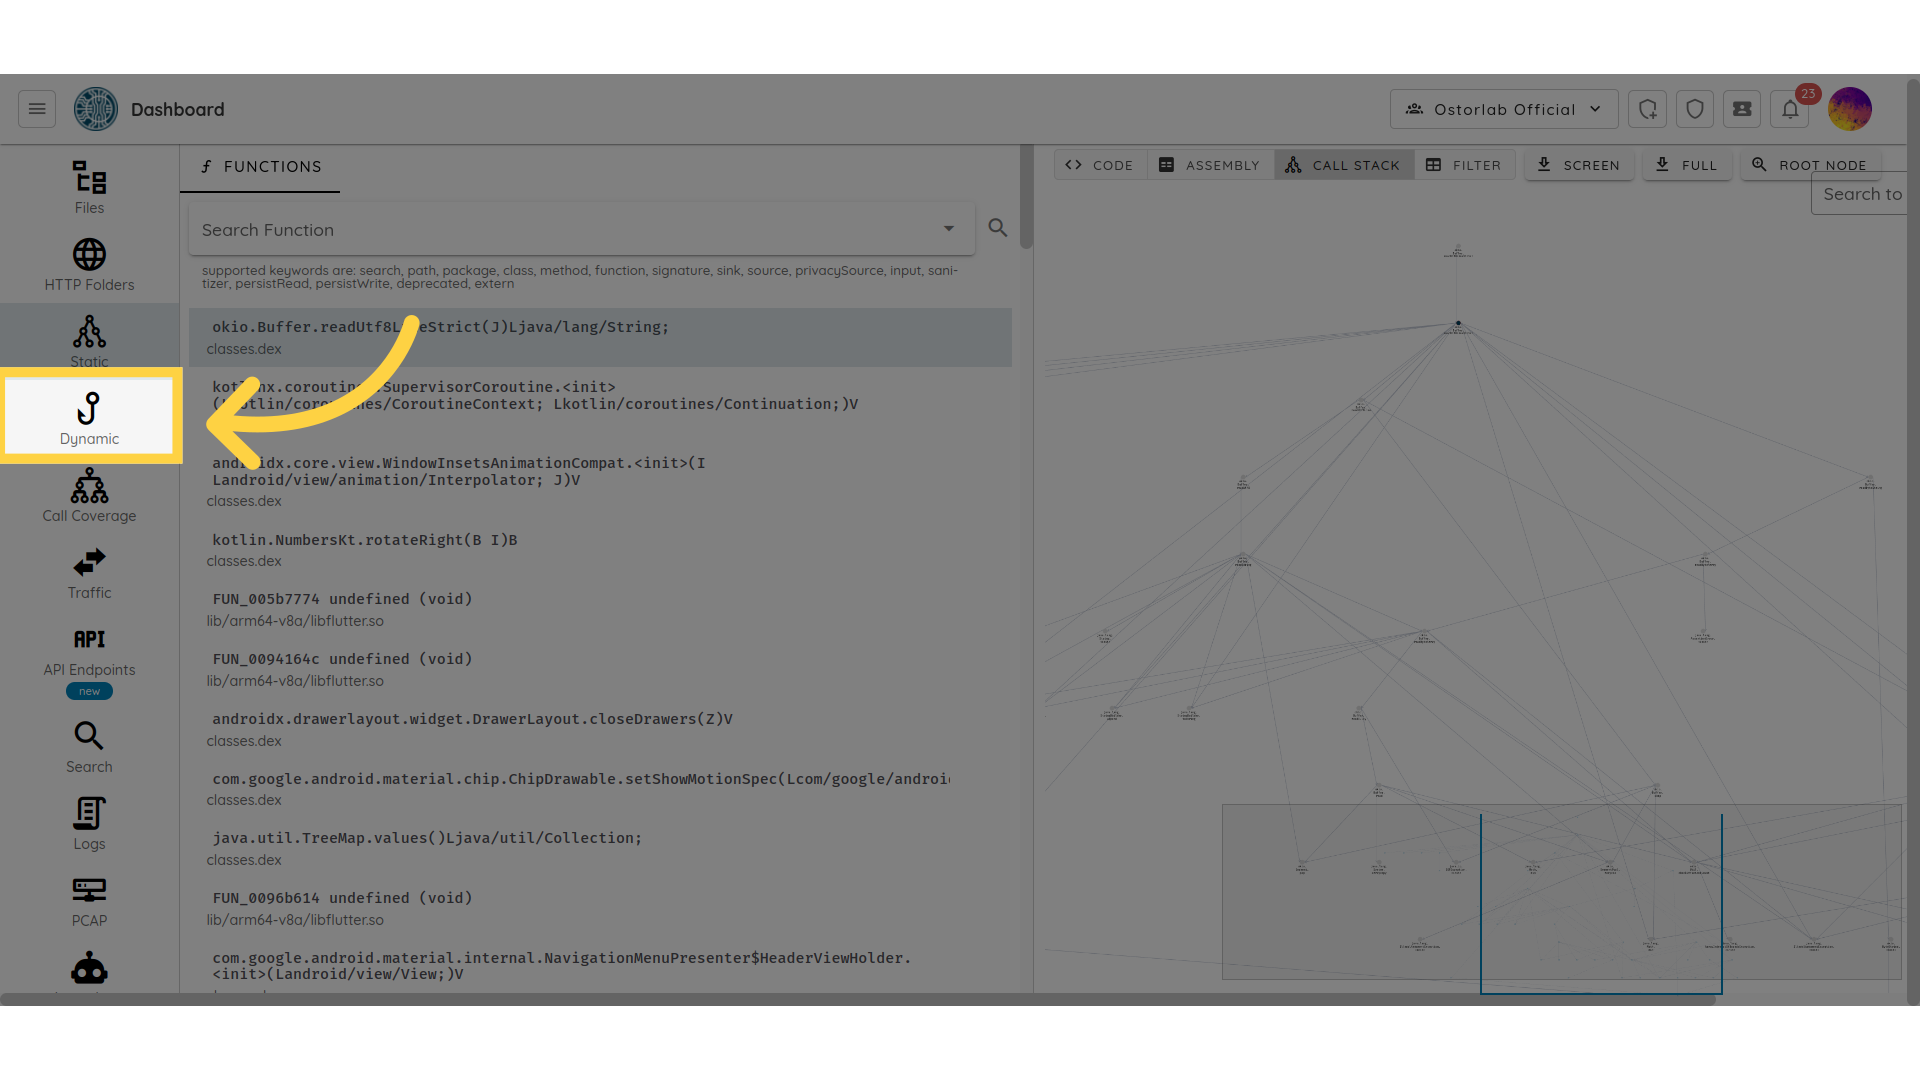
- Dynamic: The dynamic section shows call traces of the application collected during dynamic analysis. Dynamic Analysis supports Java, C, Flutter and Swift.
- Call Coverage: Call Coverage is the UI flow of the mobile application that shows you the sequence of screens or pages that the Ostorlab robots go through while using the app. It simulates how the user interacts with the app's user interface to achieve their desired goals. A typical UI flow for a mobile app might include the following steps: landing page, navigation, content pages, authentication, dialogs, and modals.
- Traffic: All the collected network traffic listed as requests.
- API: The API is the network traffic generated by the application when the Ostorlab robots interact with the application. This can help you check HTTP request/response messages that include JSON payloads, HTTP methods, HTTP protocol version, status, and the URI of the requested resource.
- Search: You can use the search section to search for a specific keyword in all application files.
- Logs: In the "Logs" section, you can view the device logs that were generated during the dynamic scan process.
- Pcap: All the registered
Pcapfiles listed for download. - Agent Logs: All logs of agents during the scan with severity, agent key and search as filters (specific to custom agents).
- Vulnerabilities: The Vulnerabilities option redirects you to the list of vulnerabilities detected by the static and the dynamic analysis.
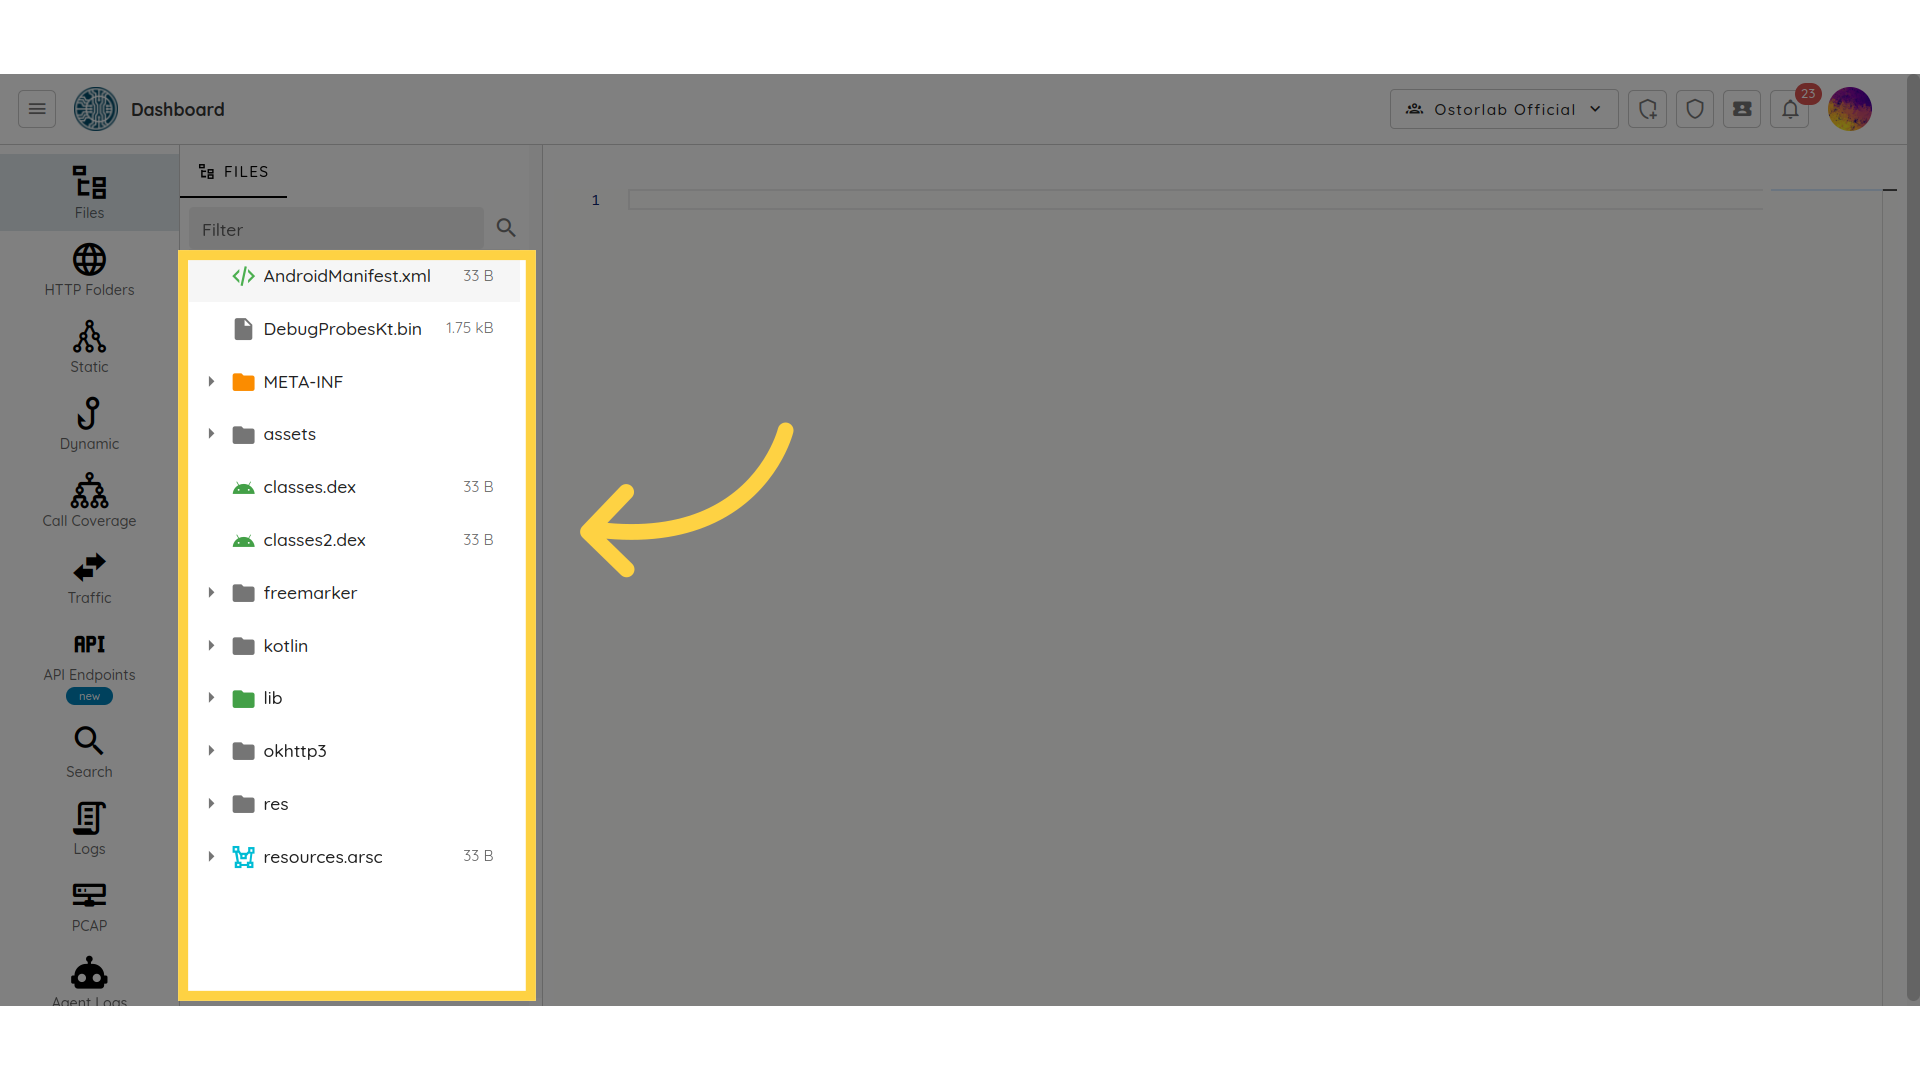
Files
This section lets you inspect the contents of APK and IPA files:
 You will see a list of files and directories that make up the app. These files may include the app's code, resources such as images and sounds, configuration files, and other assets used by the app.
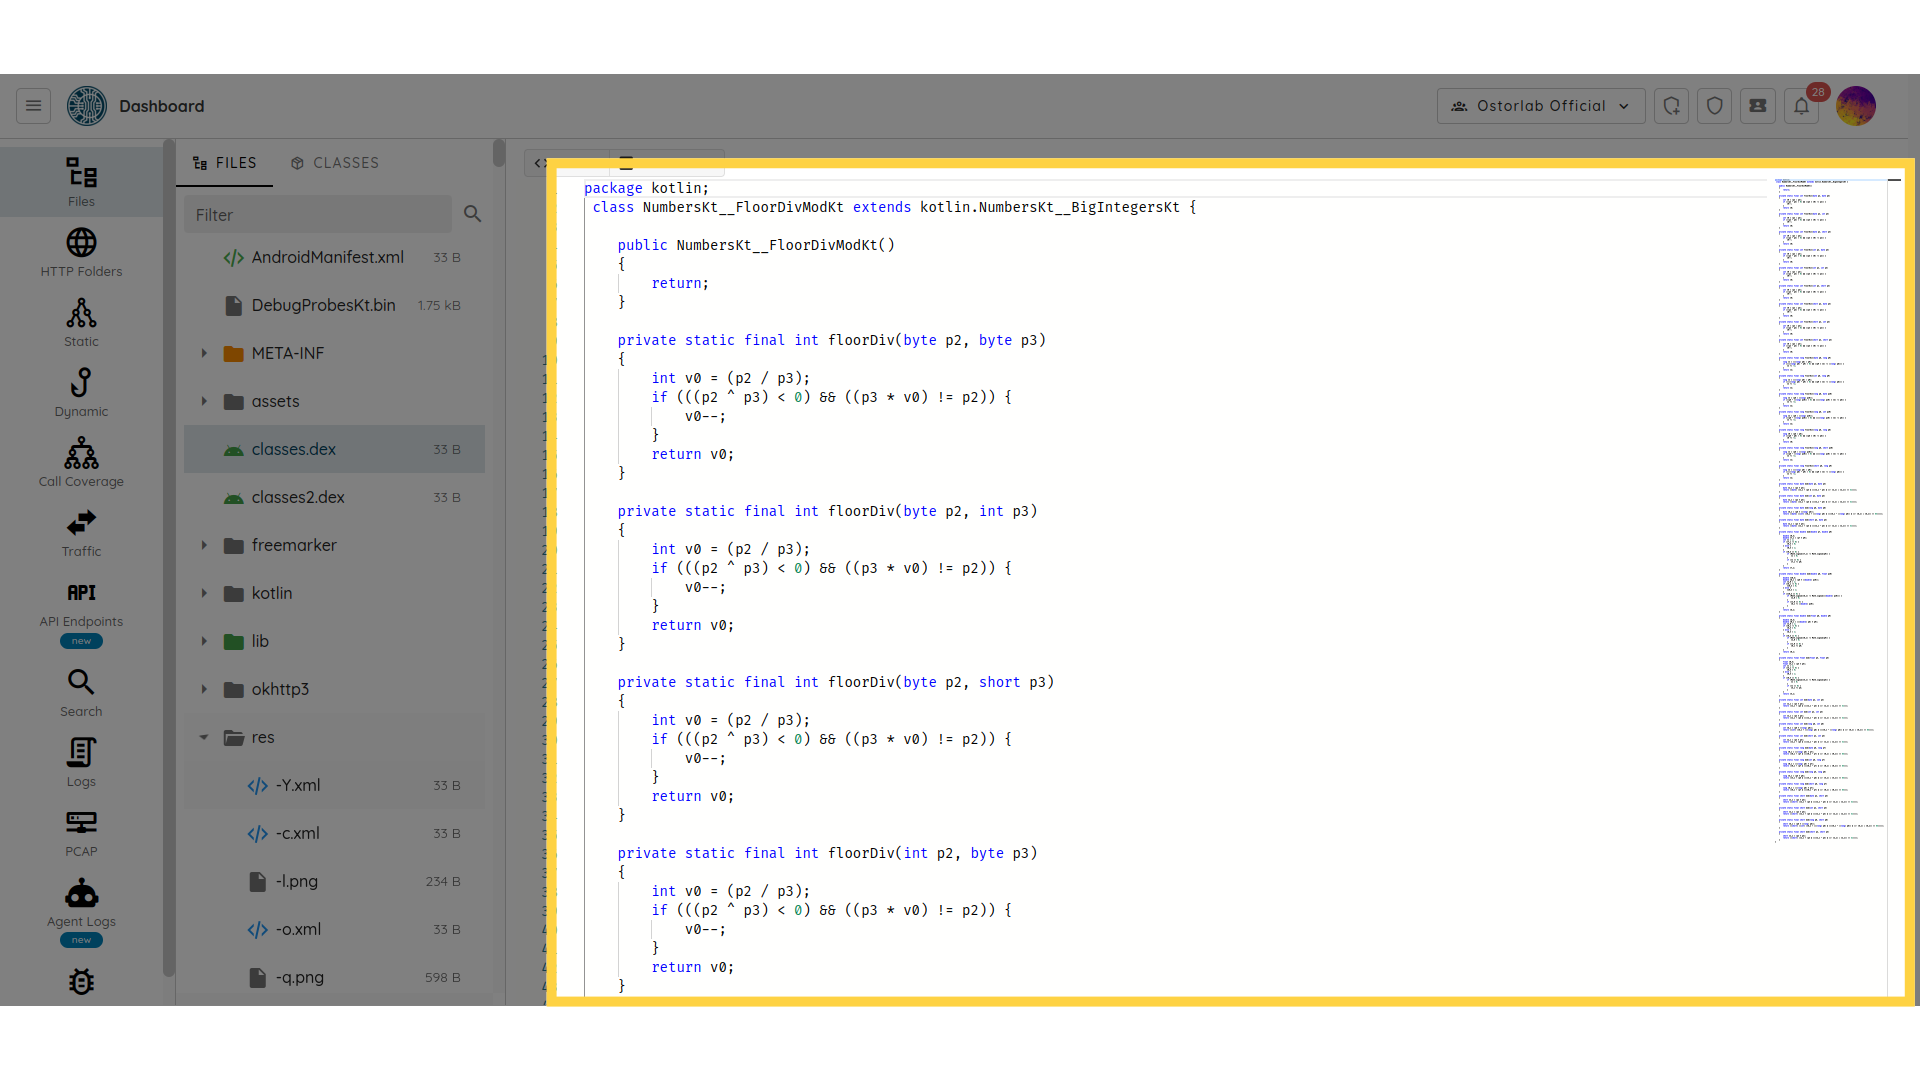
The IDE supports:
- code highlighting for most programming languages:
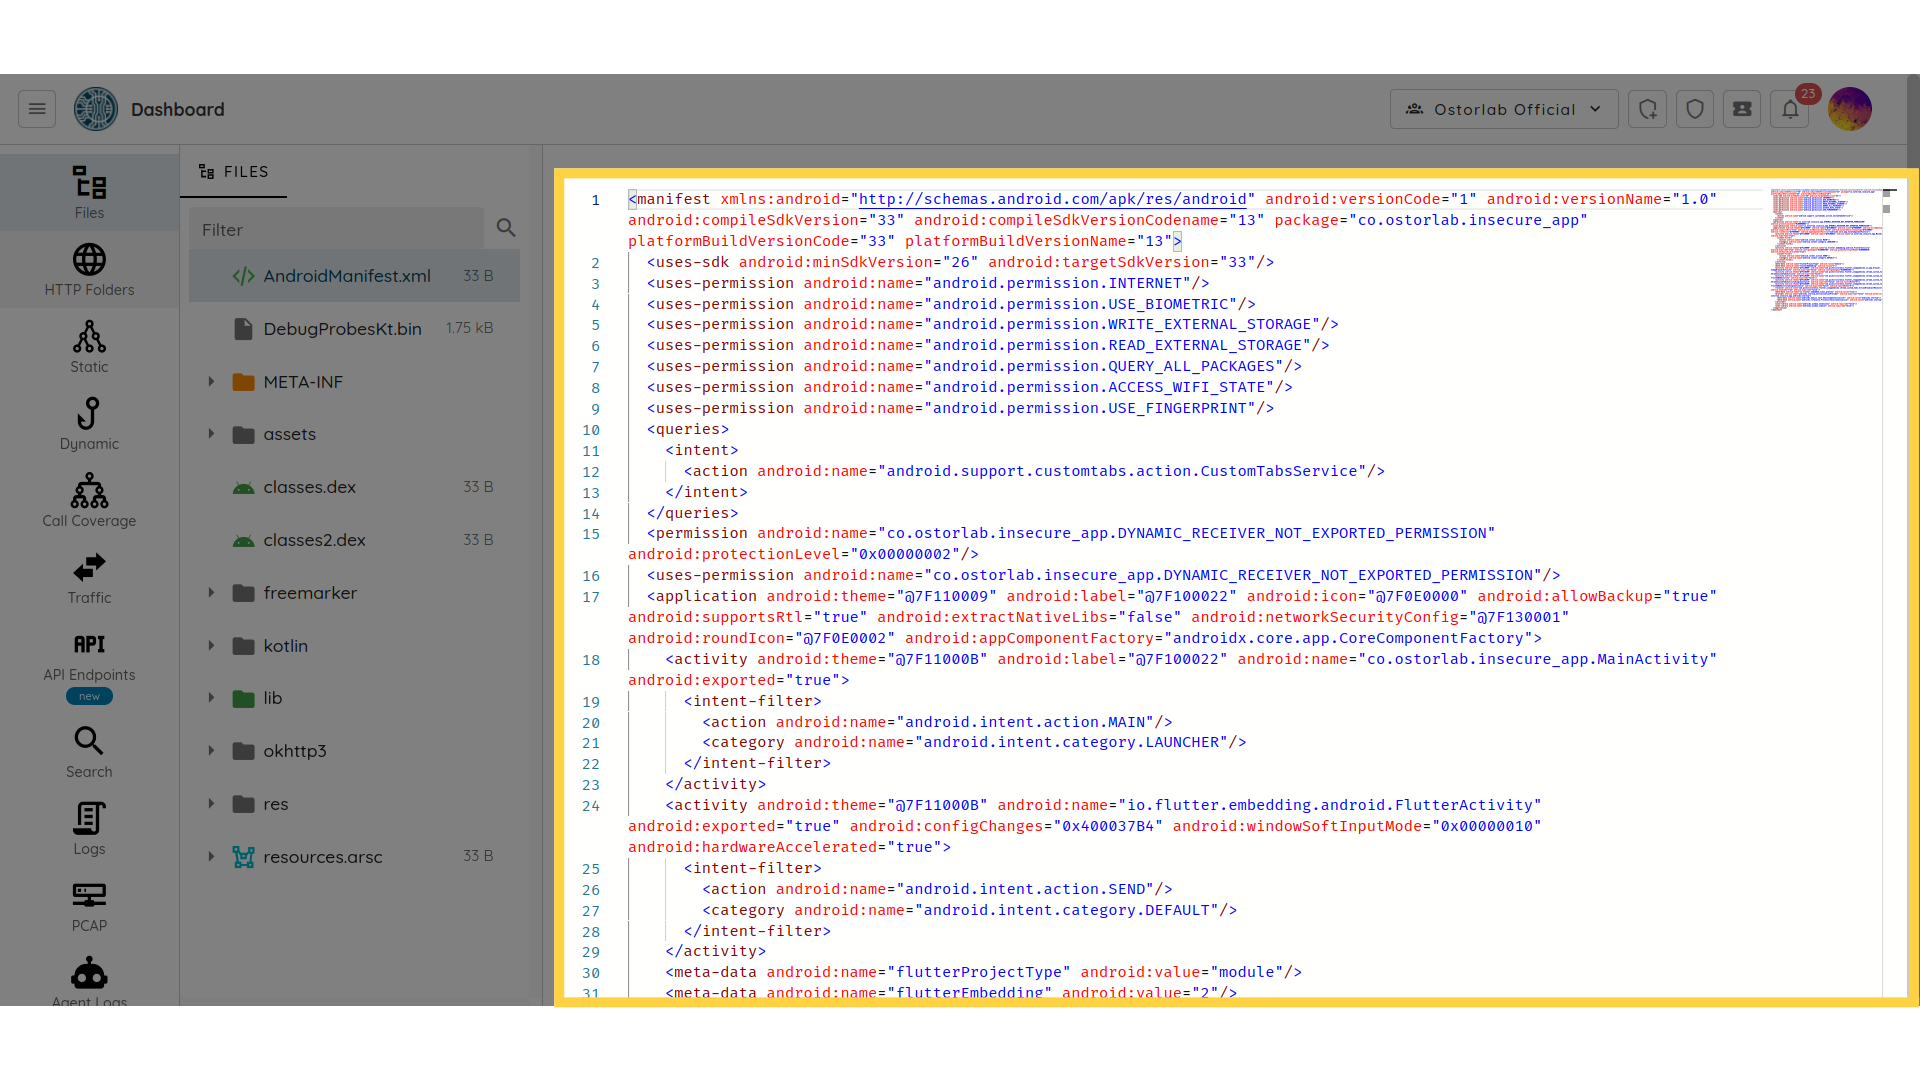
- Binary Plist extraction:
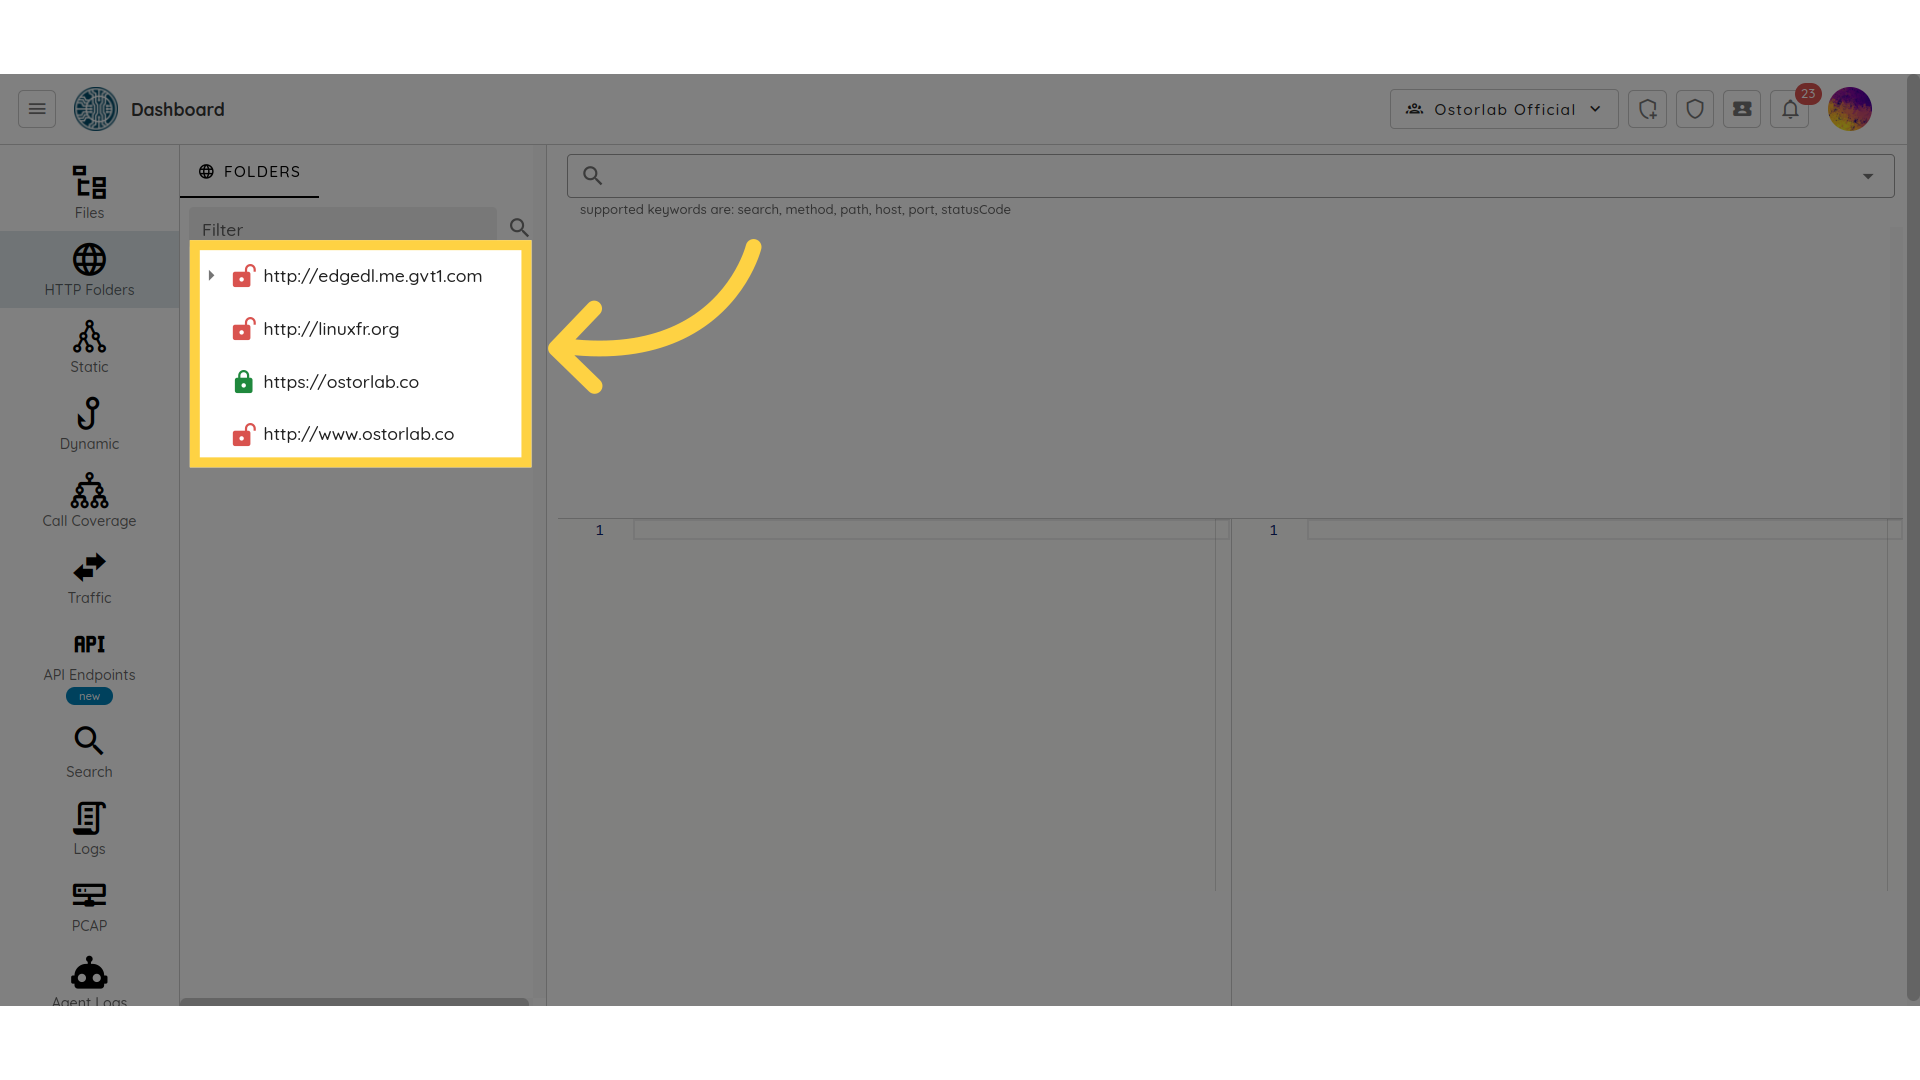
HTTP Folders
The HTTP Folders section list all collected network traffic collected and organized by endpoint:
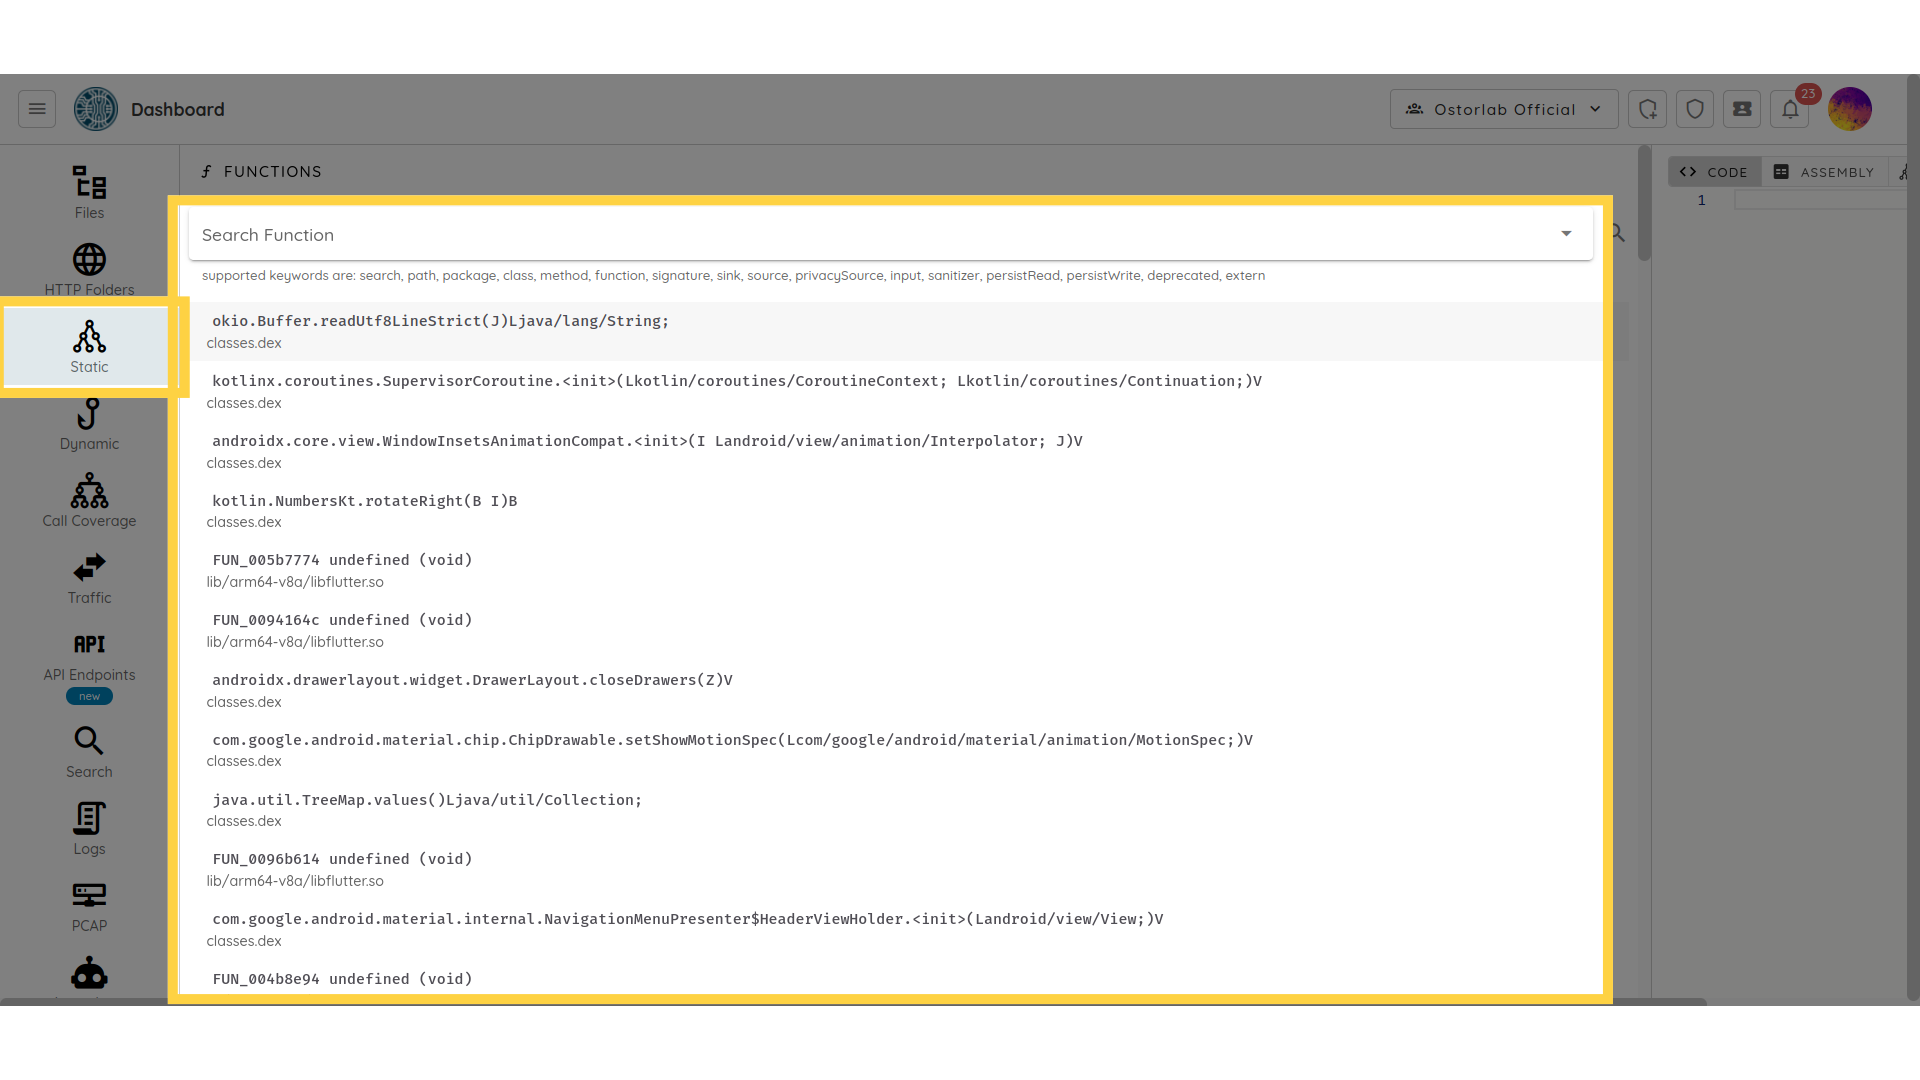
Static
The Static Analysis section is created to help engineers identify potential issues in their code. This can involve reading through the code, examining variable types and functions, and looking for common coding mistakes such as null pointer dereferences, memory leaks, or buffer overflows.
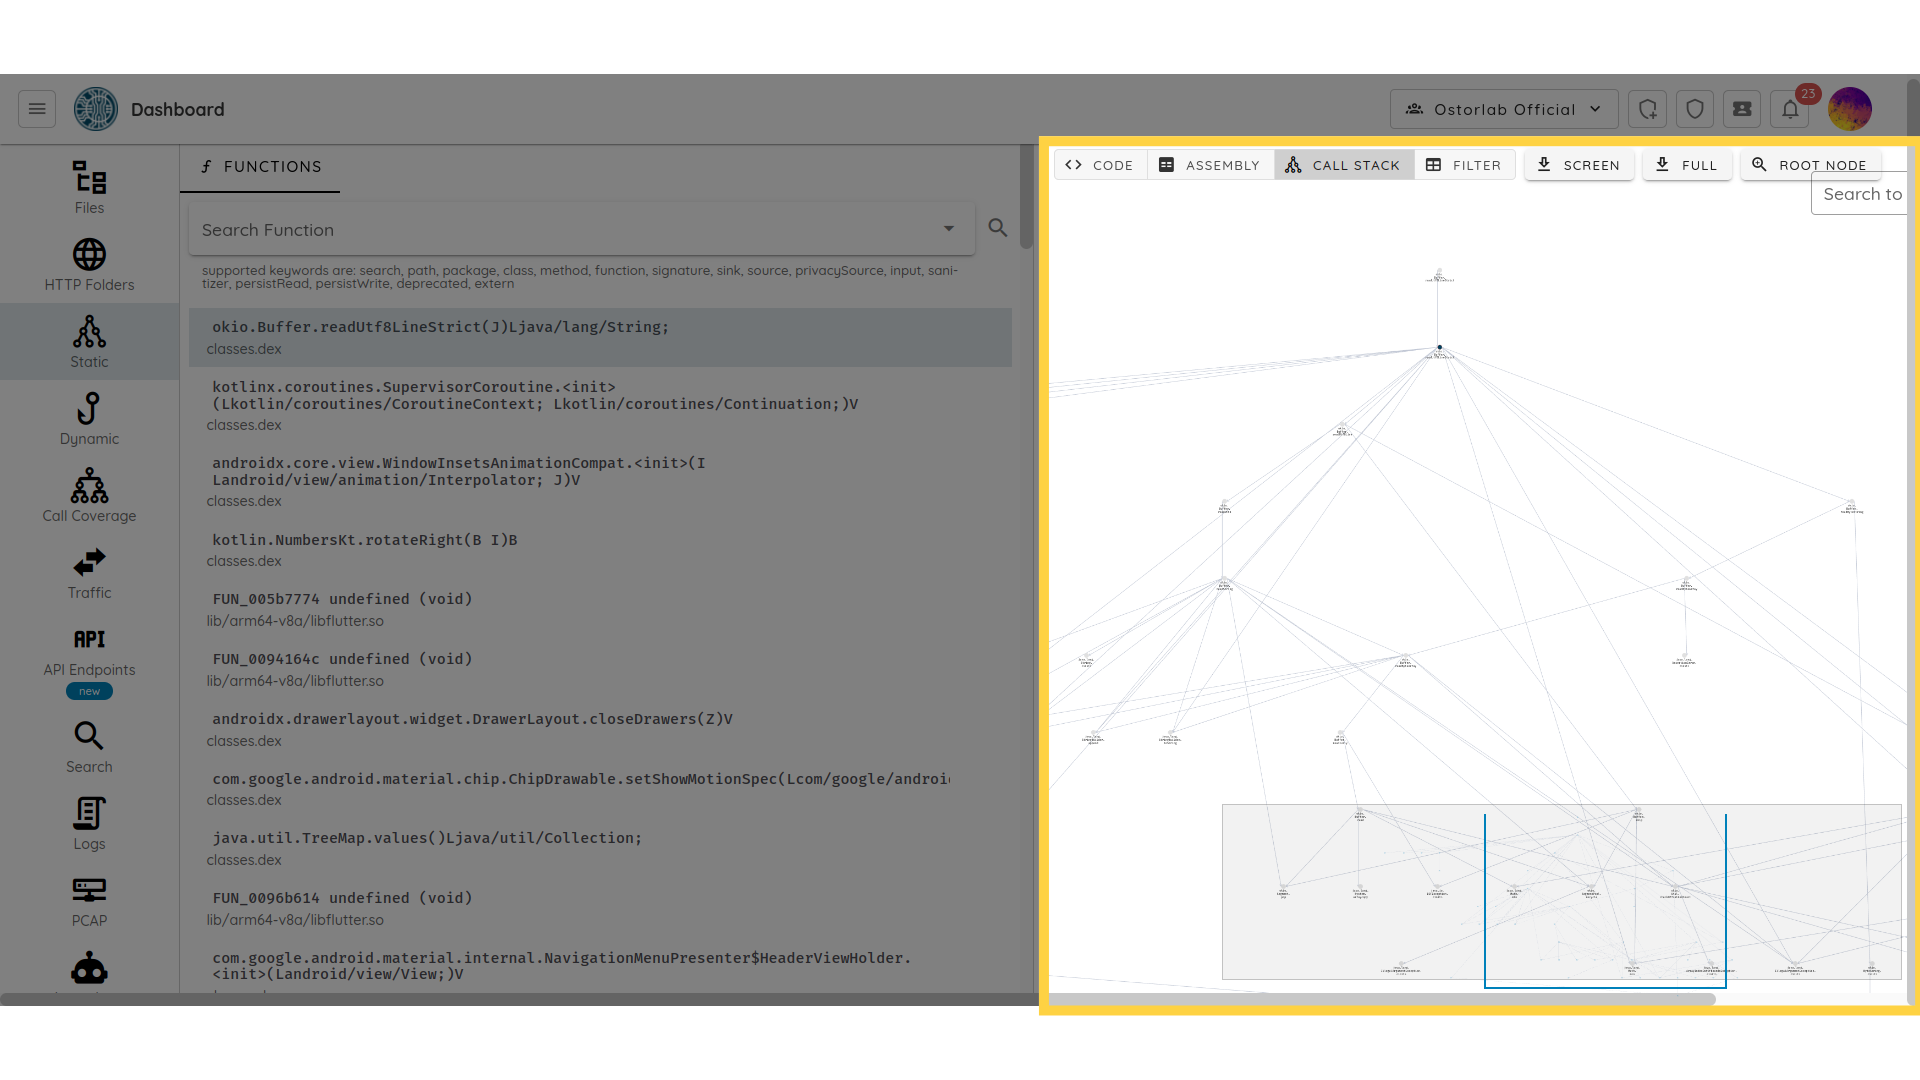
 - Contextual call trace generation
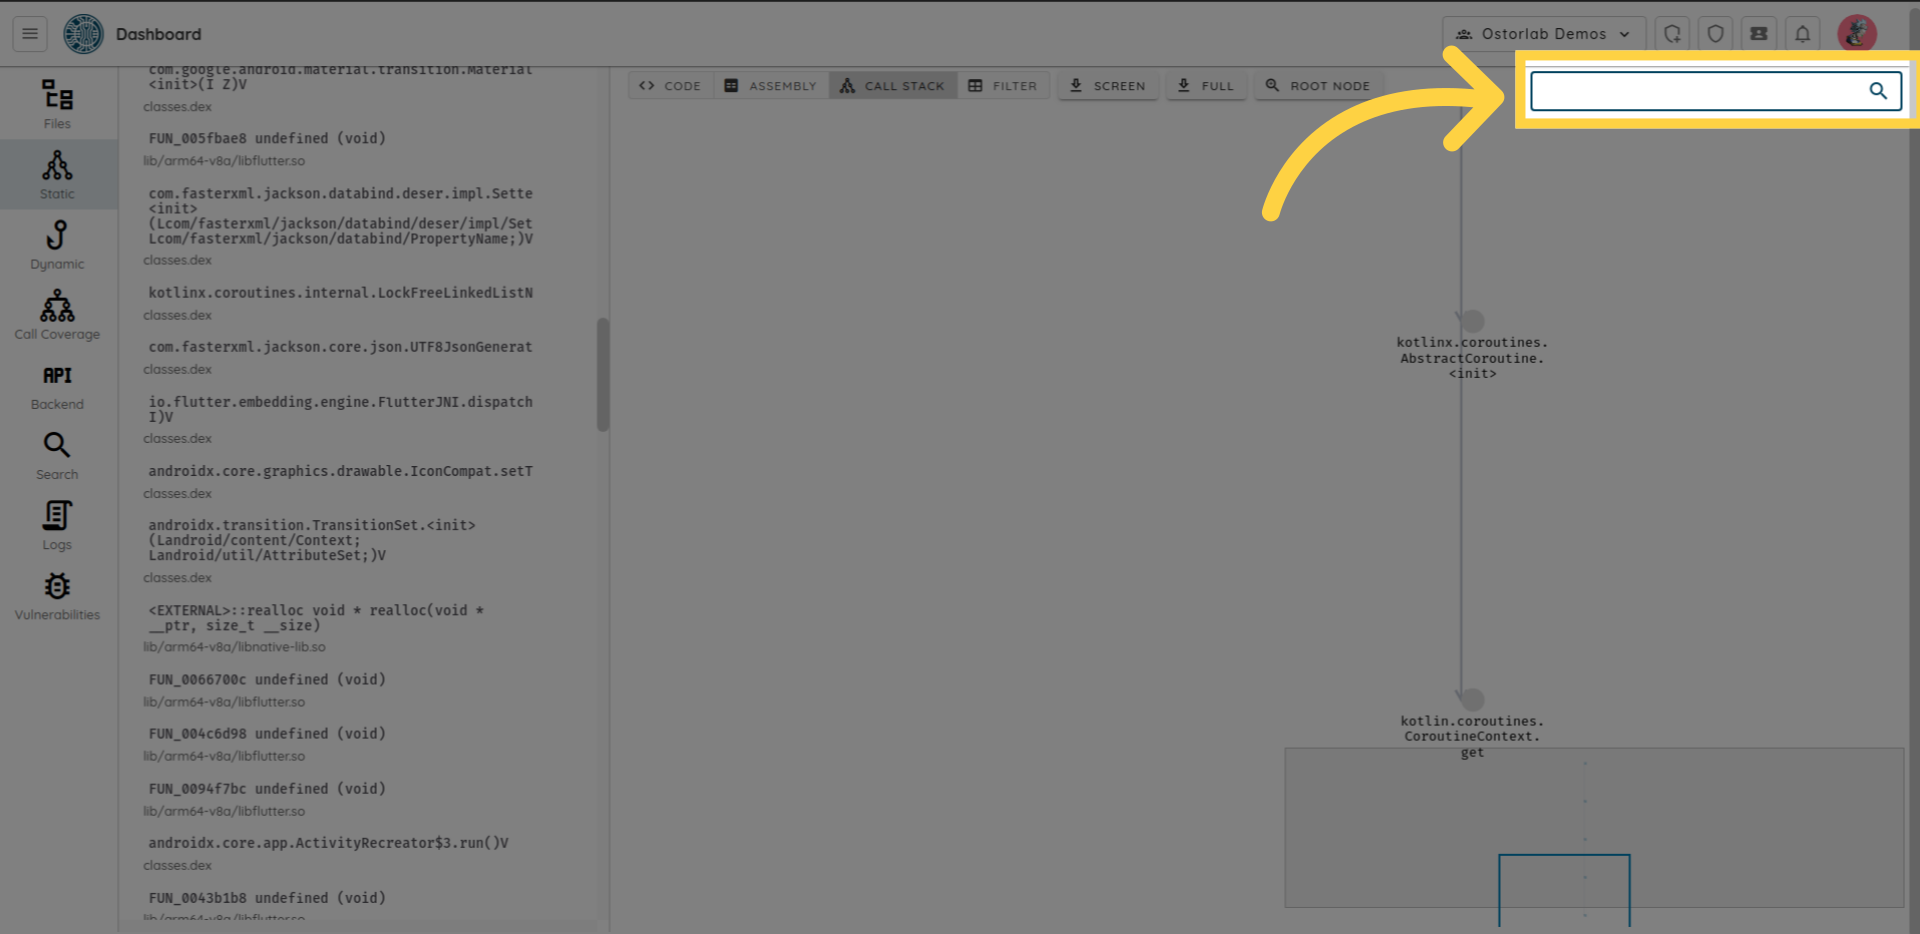
You can use search to search for a single or multiple methods.
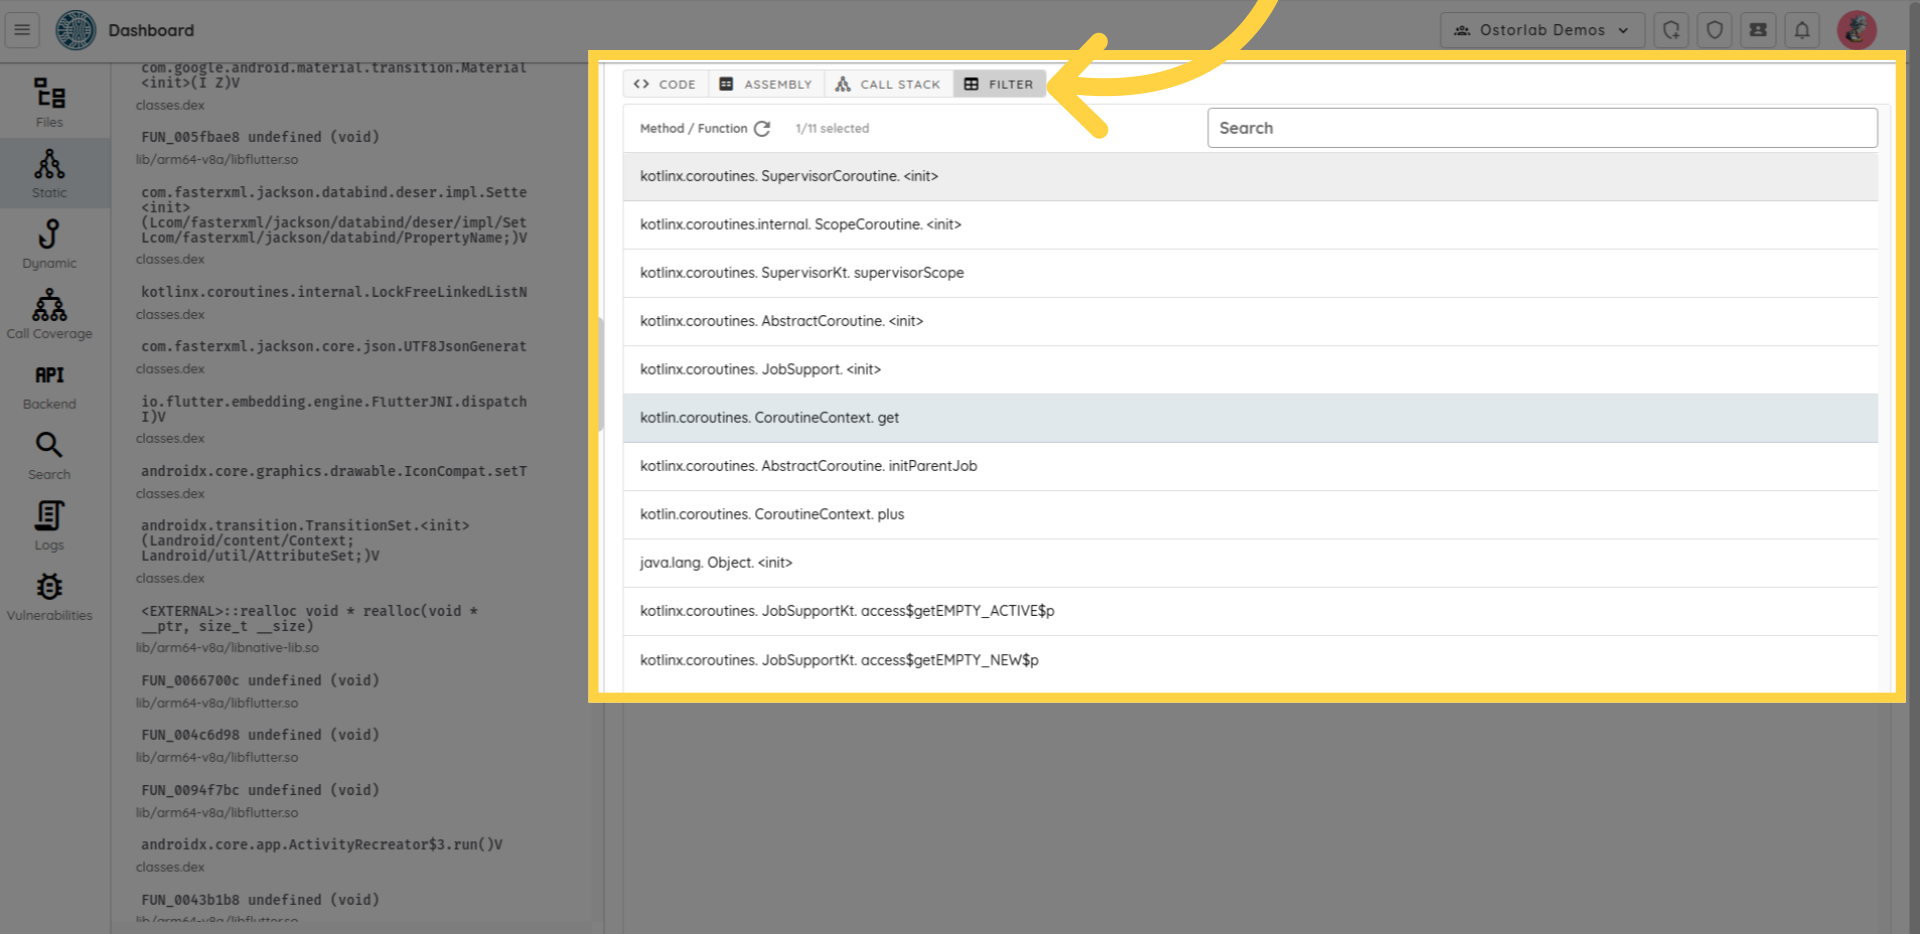
You can use the filter tab to list all the methods in a table, and then select one or multiple methods to highlight their connections within the map.
 The search feature in static analysis supports multiple keywords that can be chained together.
For example, to search for all methods containing the word "mem". You can type search colon mem
The search feature in static analysis supports multiple keywords that can be chained together.
For example, to search for all methods containing the word "mem". You can type search colon mem
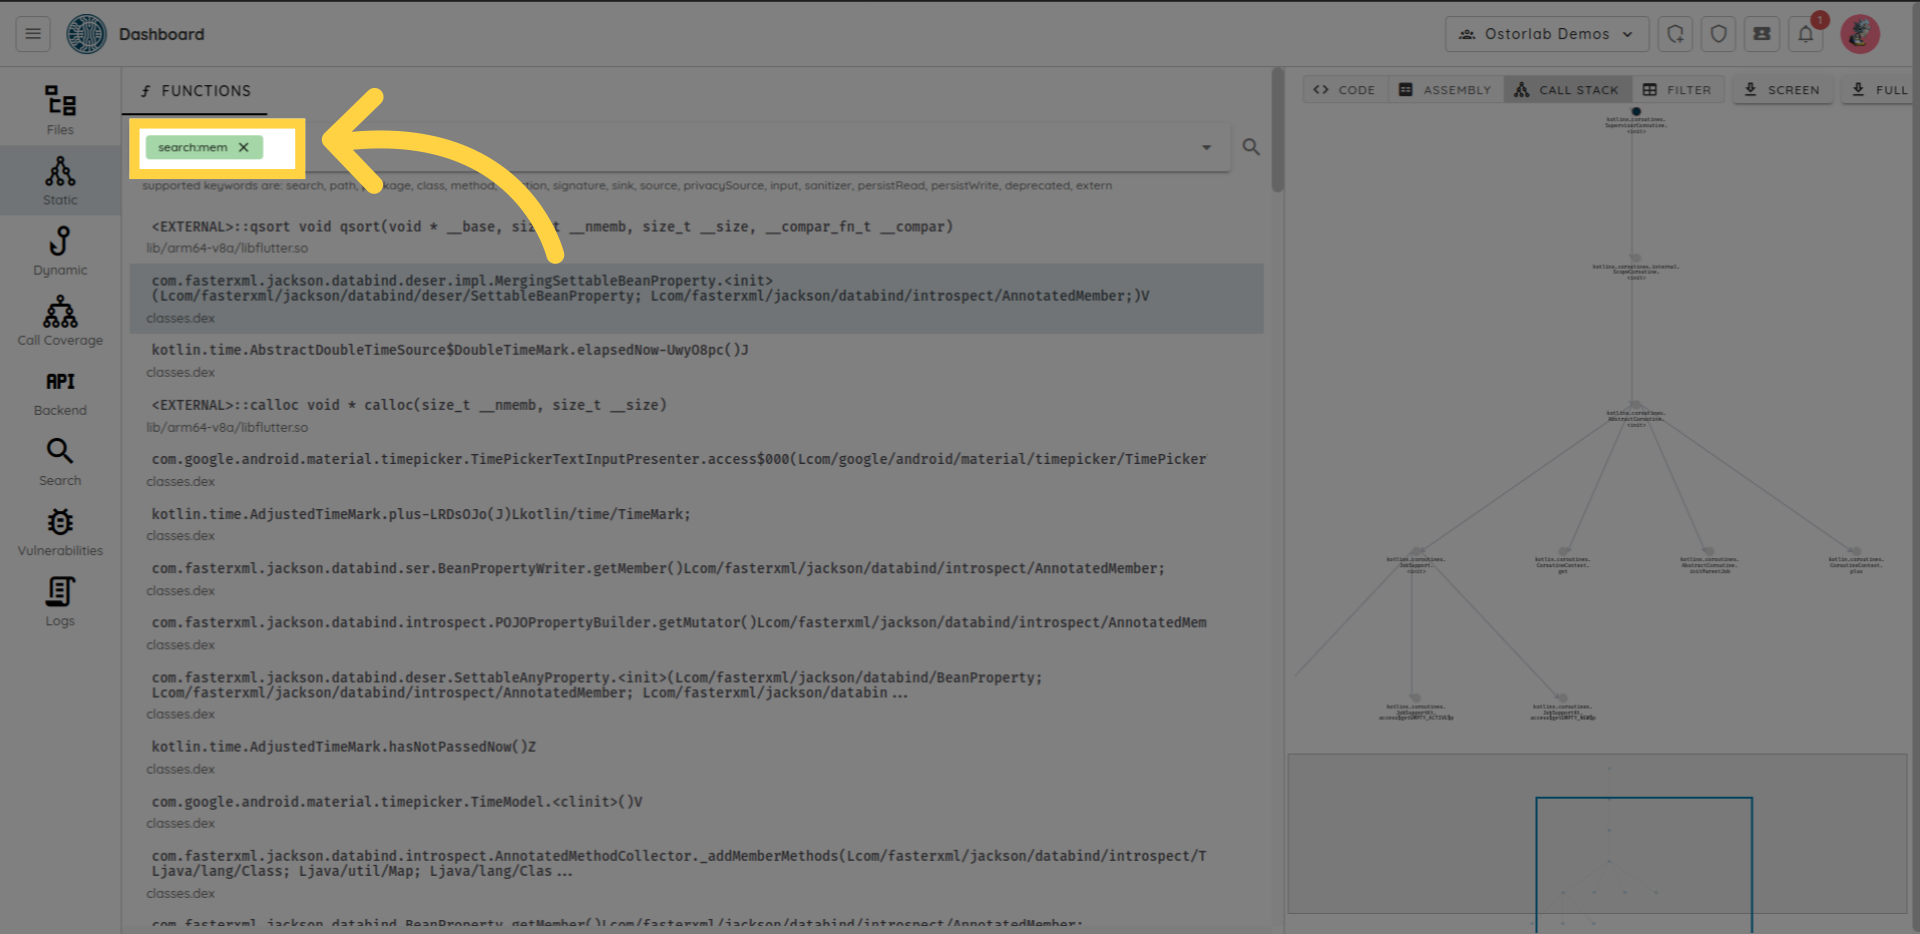 The list of supported keywords is:
search: arbitrary search within all the method or function attributes.path: path with the APK or IPA file.package: package name if applicable.class: class name if applicable.method: method name.function: function name.signature: method or function signature.sink: sink category, supports*as wildcard.source: source category, supports*as wildcard.privacySource: privacy source category, supports*as wildcard.input: input category, supports*as wildcard.sanitizer: sanitizer category, supports*as wildcard.persistRead: persist read category, supports*as wildcard.persistWrite: persist write category, supports*as wildcard.deprecated: the function or method is deprecated in the latest API.
Function tagging helps identify security hotspots. A simple use-case is to find all methods that can result in an SQL injection, use the call trace feature to see where the method is used, and if an attacker potentially controls the input:
The tagging differentiates between:
- Sink: over a dozen sink categories. Sinks are functions or method that can lead to vulnerabilities, like execSQL that can lead to SQL injection if the user controls the input.
- Source: Source function and methods return untrusted input that could come from the network, IPC, filesystem (external storage) ...
- Privacy Source: Privacy source functions and methods return sensitive input, like user location, SMS, Wi-Fi endpoints that can affect the privacy of the user
- Input: Input methods are typically overridable methods that serve as callbacks and whose parameters are untrusted and can be manipulated by an attacker. A typical example is content providers query, update, insert, delete, etc. methods.
- Sanitizer: sanitizer functions and methods are used to scrub untrusted input for particular API use.
- Persist Read and Write: Persist read and write are helpful to find second order injection vulnerabilities. Read and Write operations are separate.
- Deprecated: simply deprecated functions and methods.
Dynamic
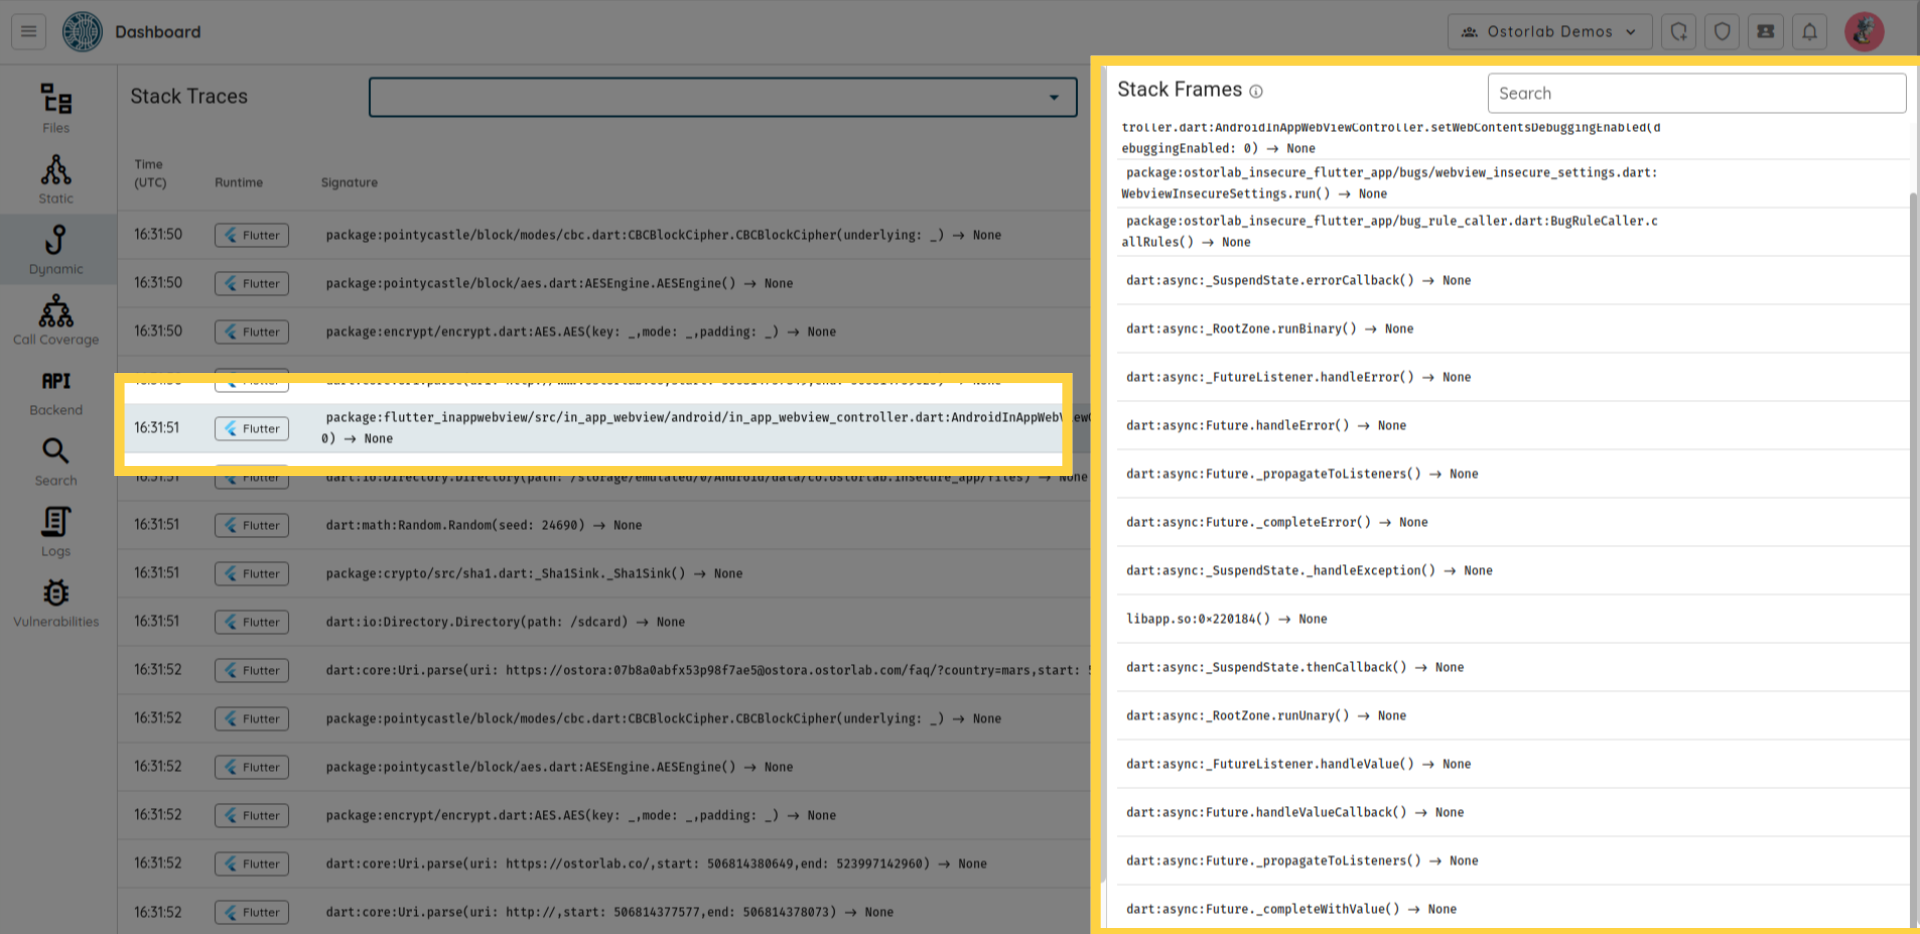
The Dynamic Analysis section shows call traces of the application collected during dynamic analysis.
Dynamic Analysis supports Java, C, Flutter, and Swift.
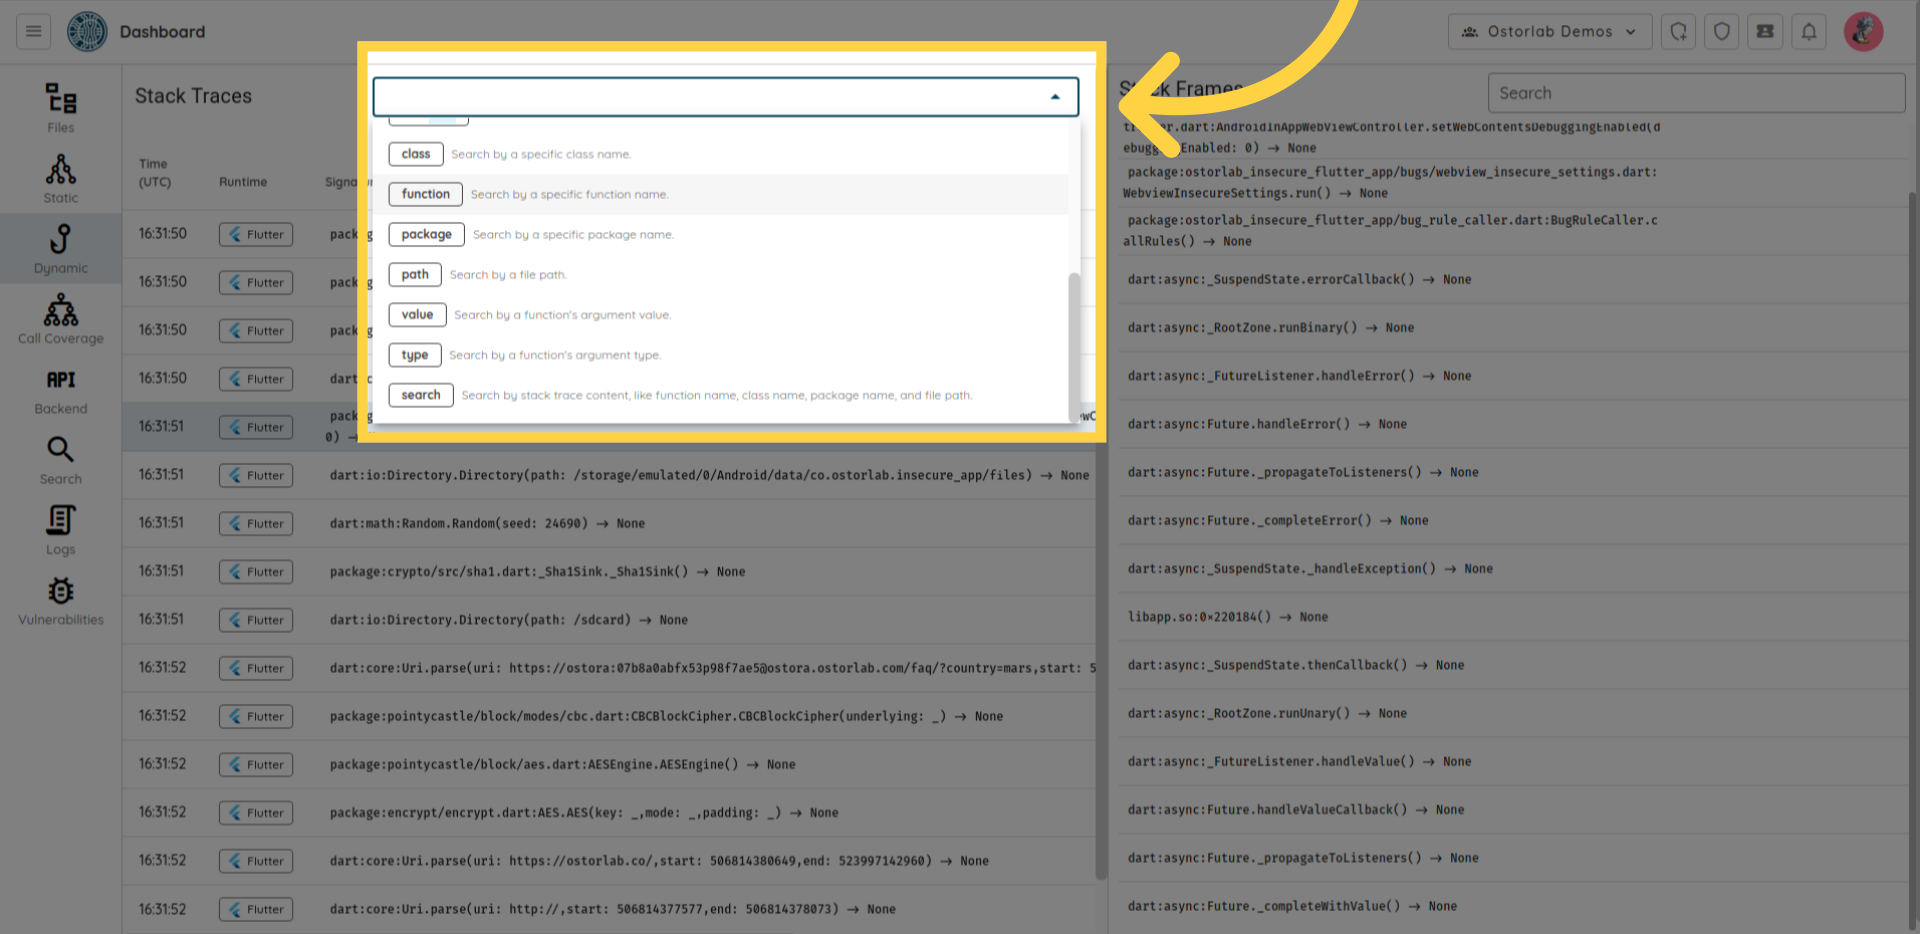
You can click on any stack trace to see its frames.
 You can filter call traces by: class name, function, package, path, value, and type.
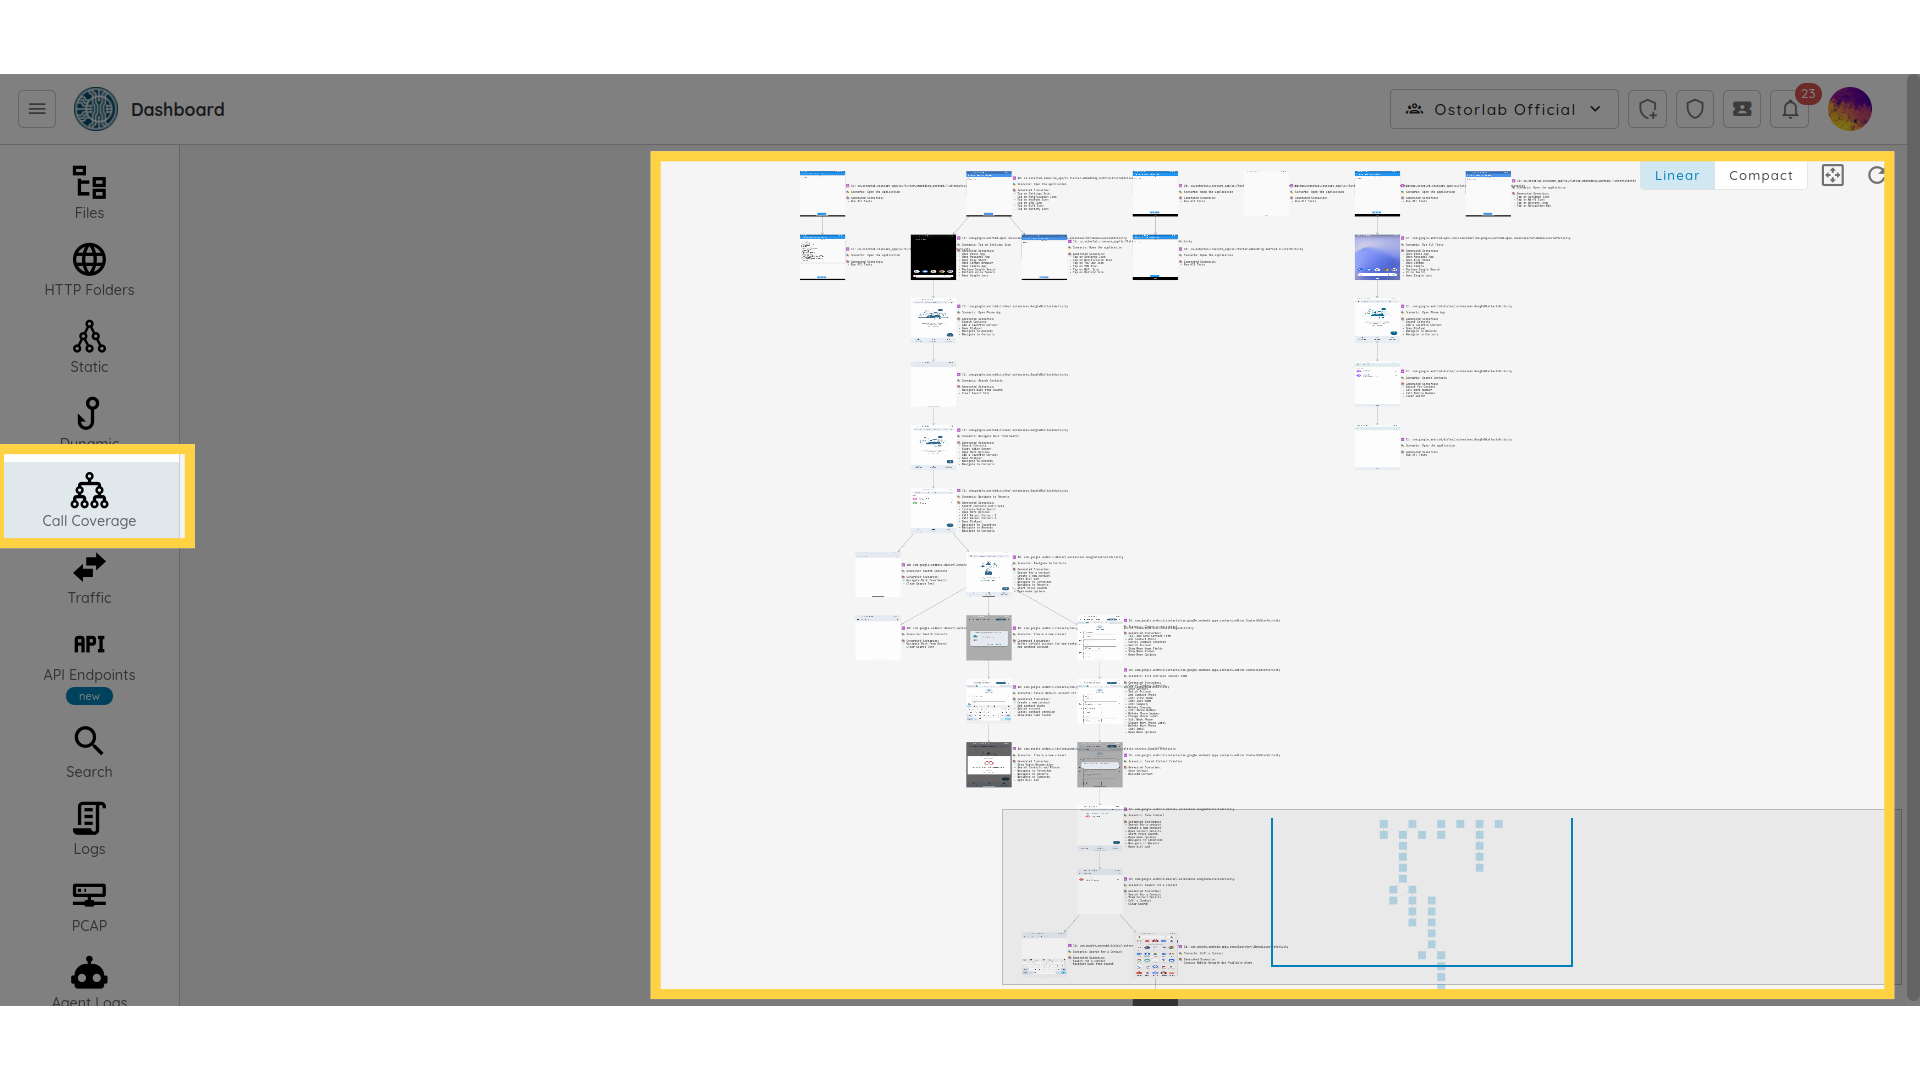
Call coverage
The Call Coverage section shows the UI flow of the mobile application
that shows you the sequence of screens or pages that the Ostorlab robots go through while using the app.
It simulates how the user interacts with the app's user interface to achieve their desired goals.
A typical UI flow for a mobile app might include the following steps:
landing page, navigation, content pages, authentication, dialogs, and modals.
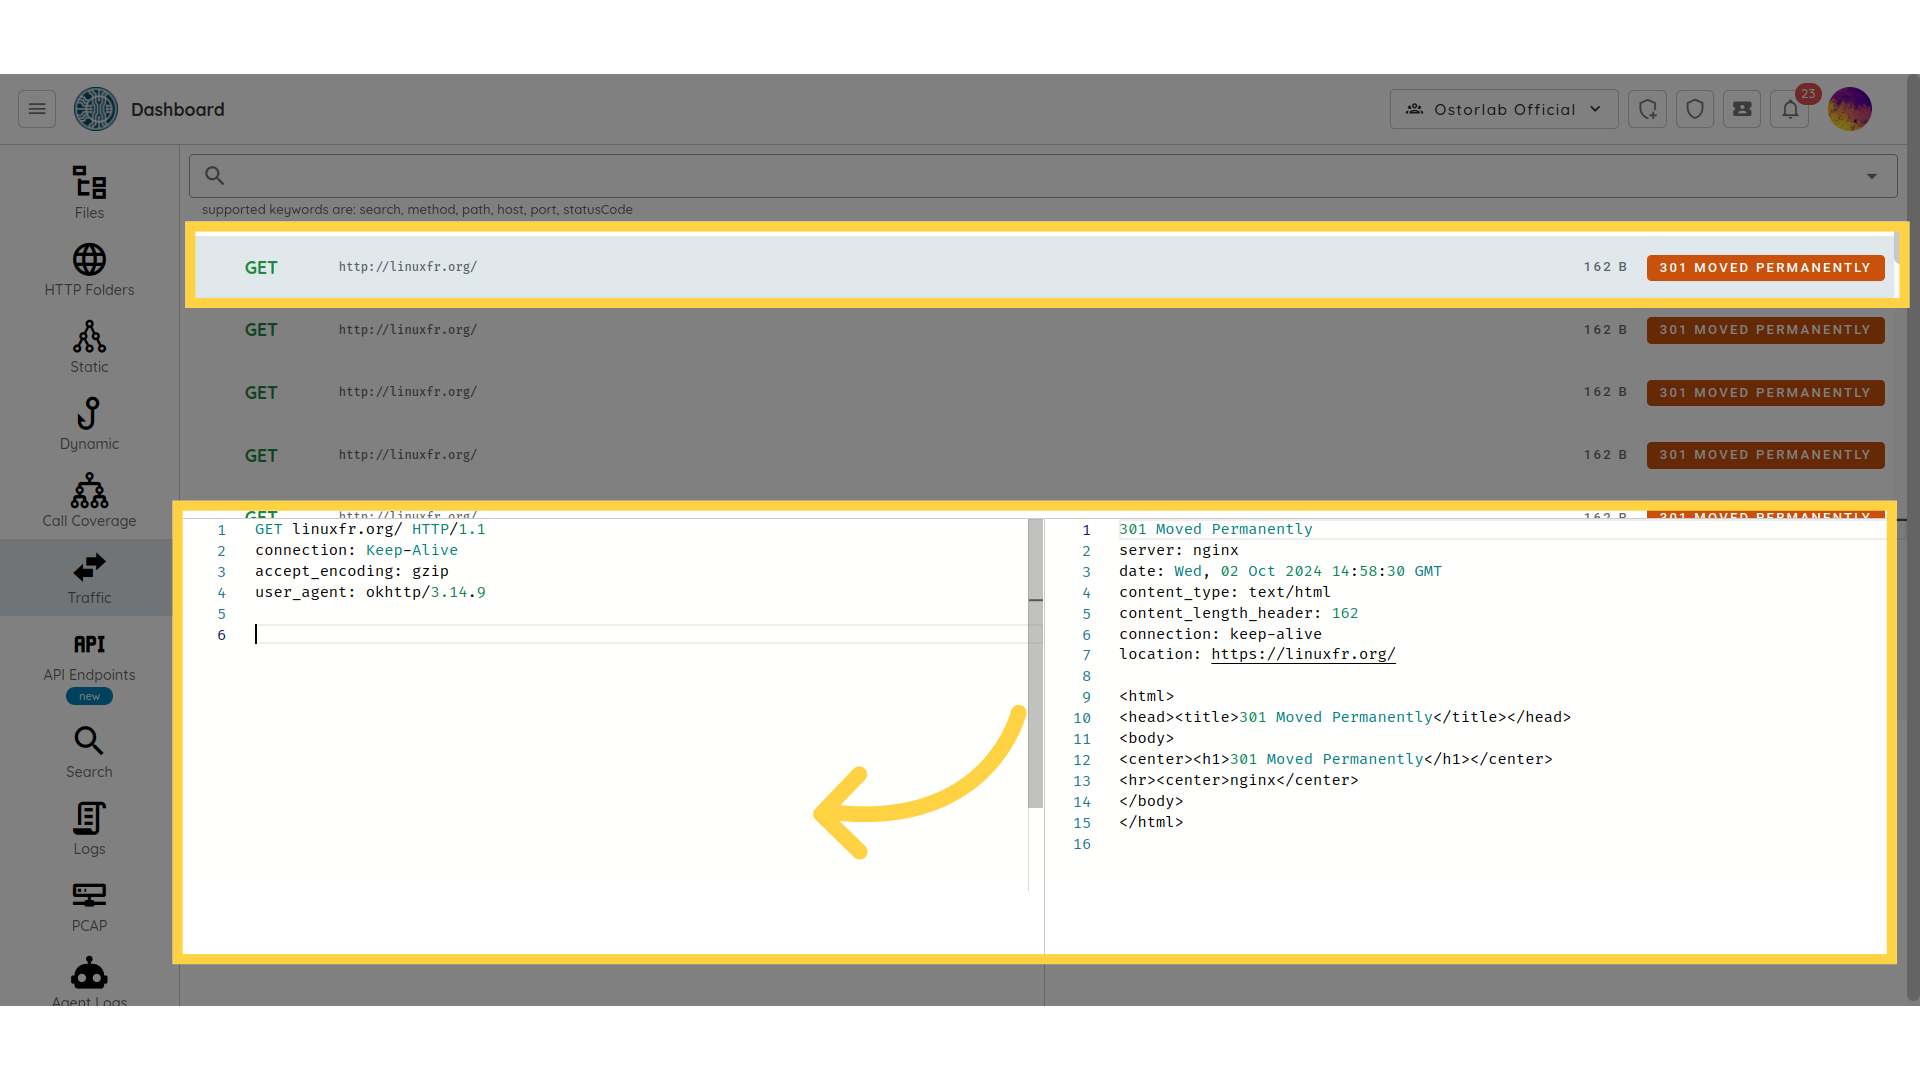
Traffic
The Traffic section lists all the traffic collected Throughout the dynamic scan.
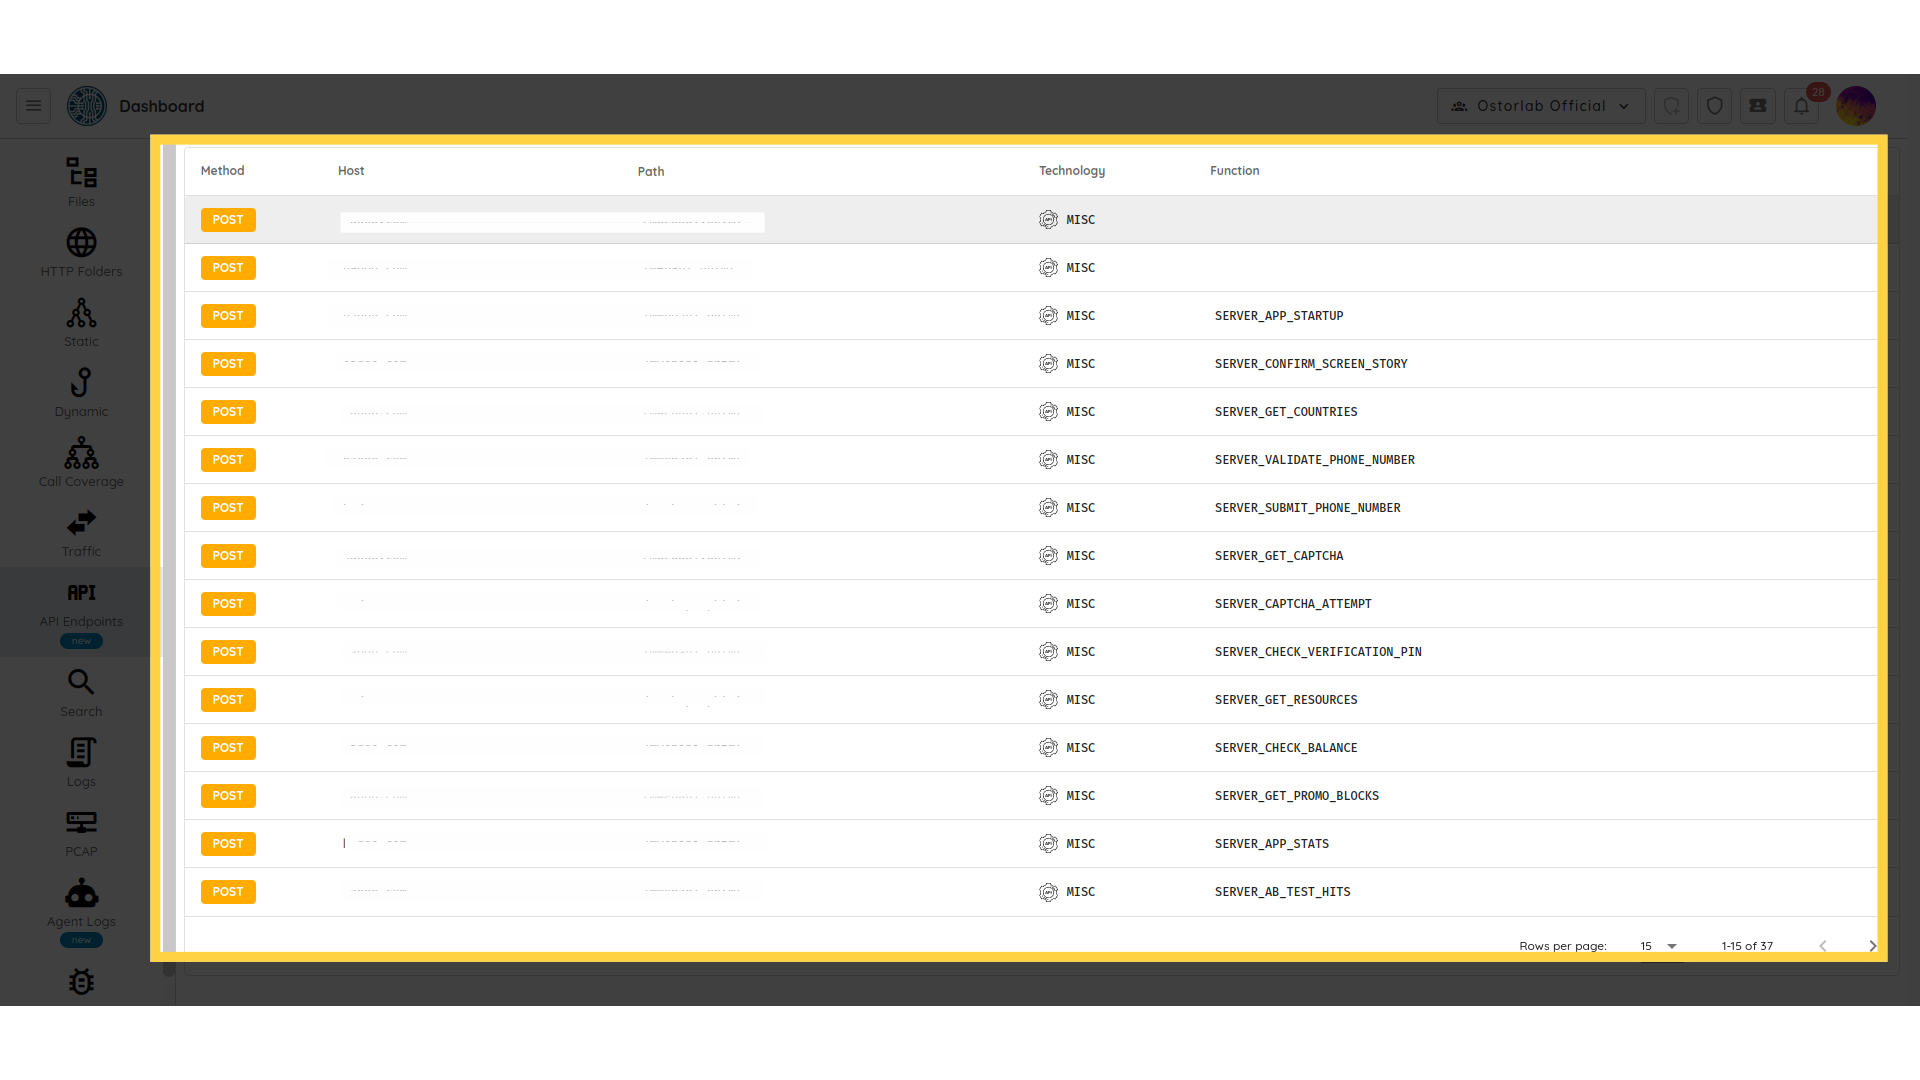
API
The API section shows the network traffic
generated by the application when the Ostorlab robots interact with the application.
This can help you check HTTP request/response messages that include JSON payloads,
HTTP methods, HTTP protocol version, status, and the URI of the requested resource.
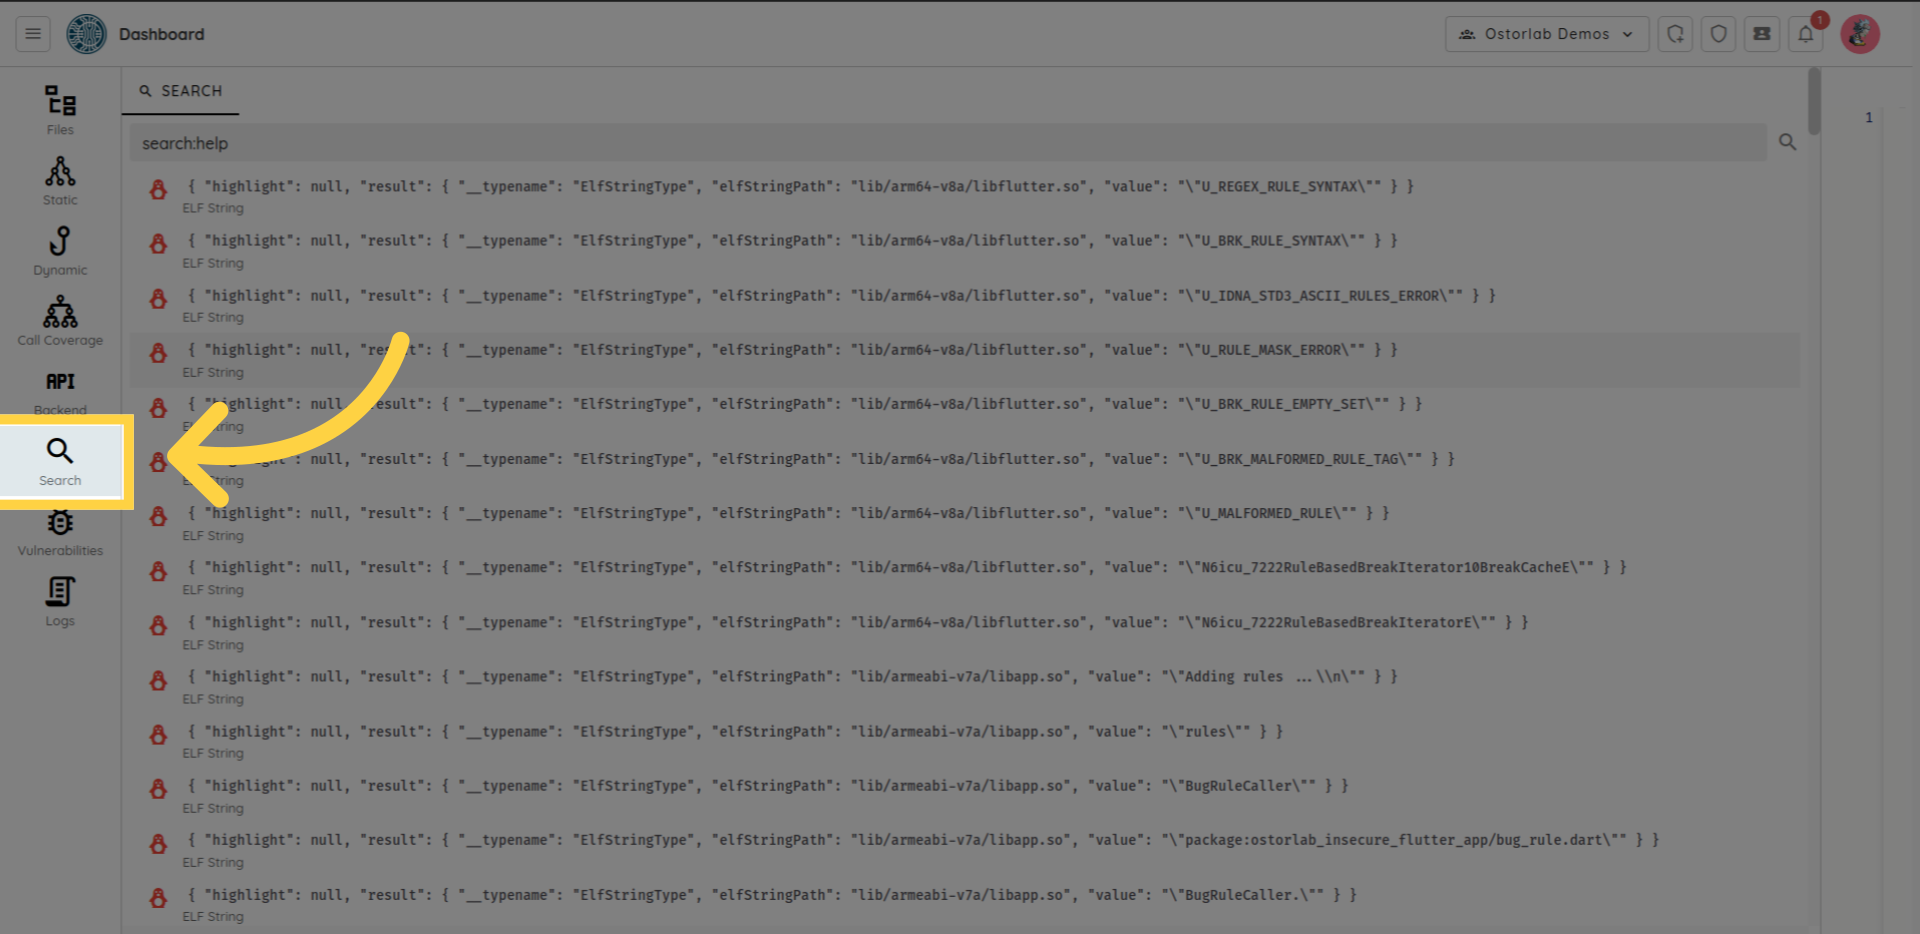
Search
You can use the search section to search for a specific keyword in all application files.
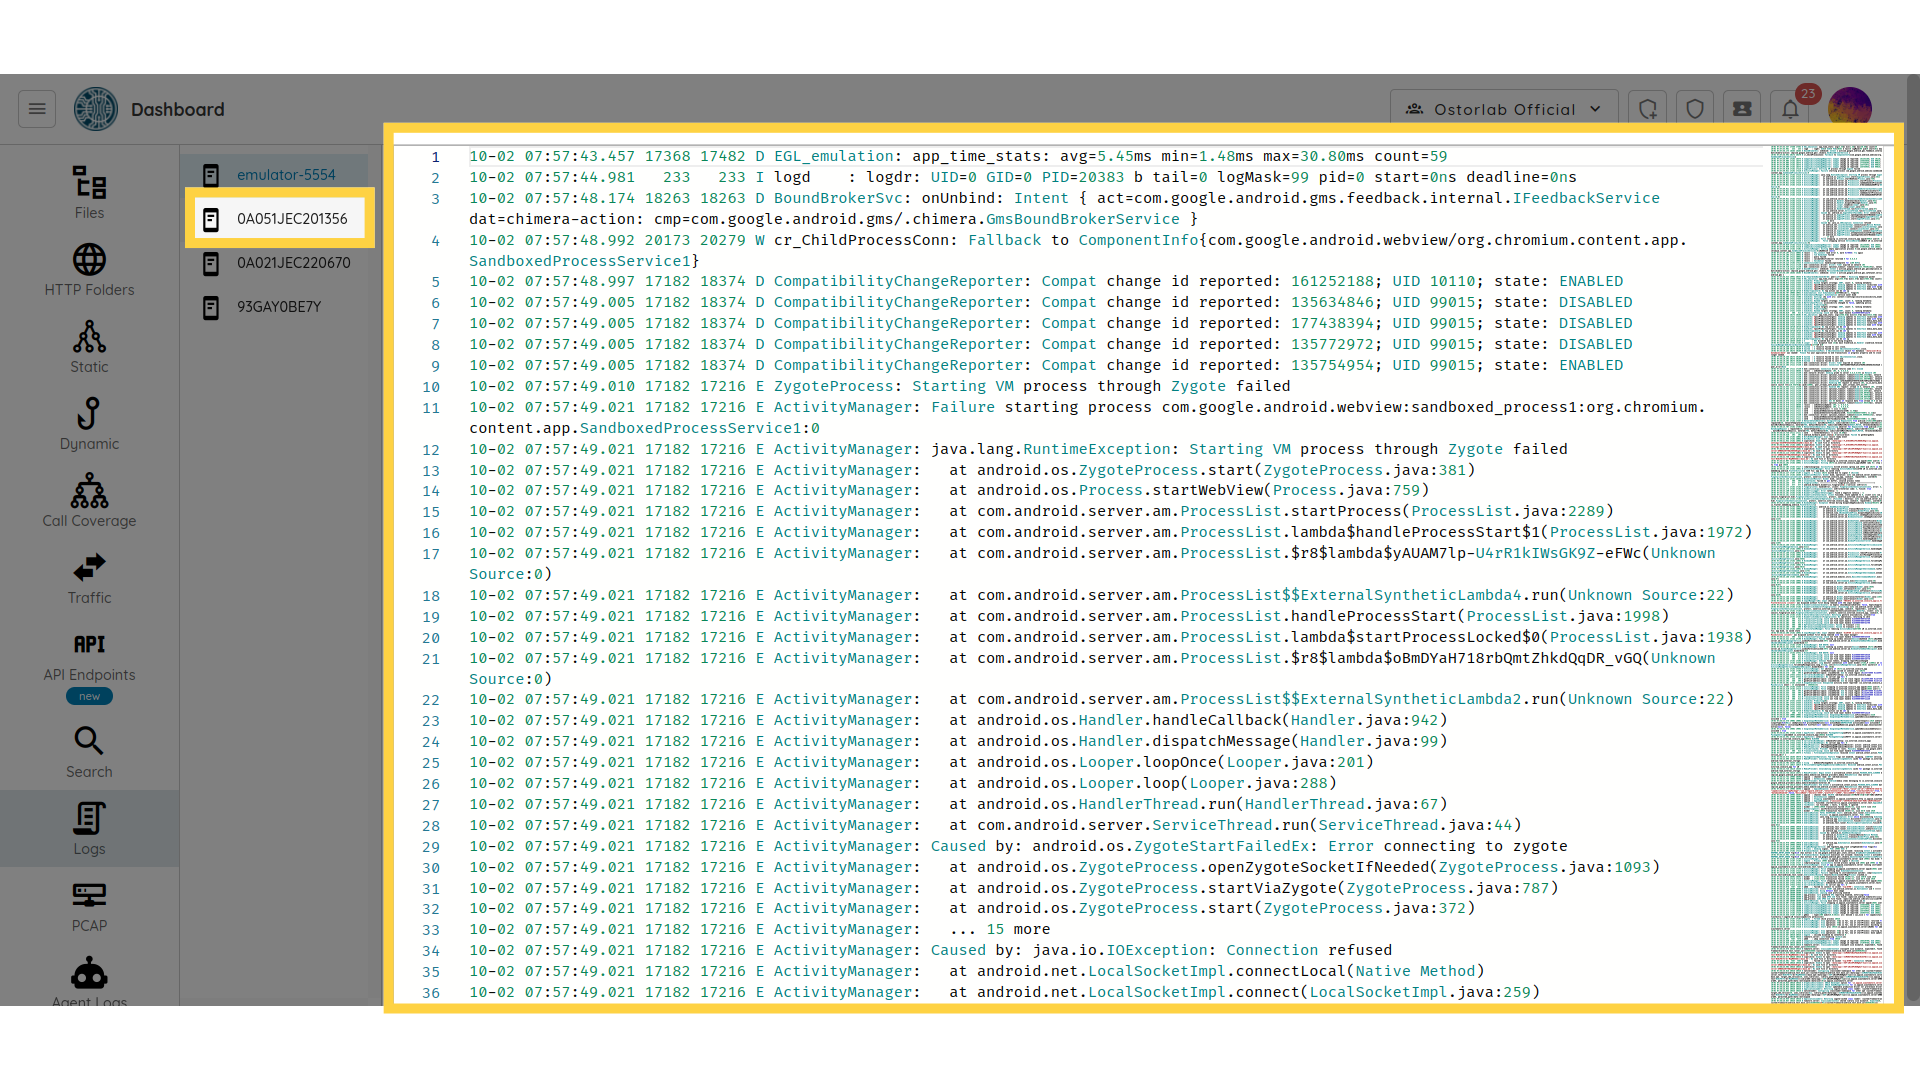
Logs
In the "Logs" section, you can view the device logs generated during the dynamic scan process.
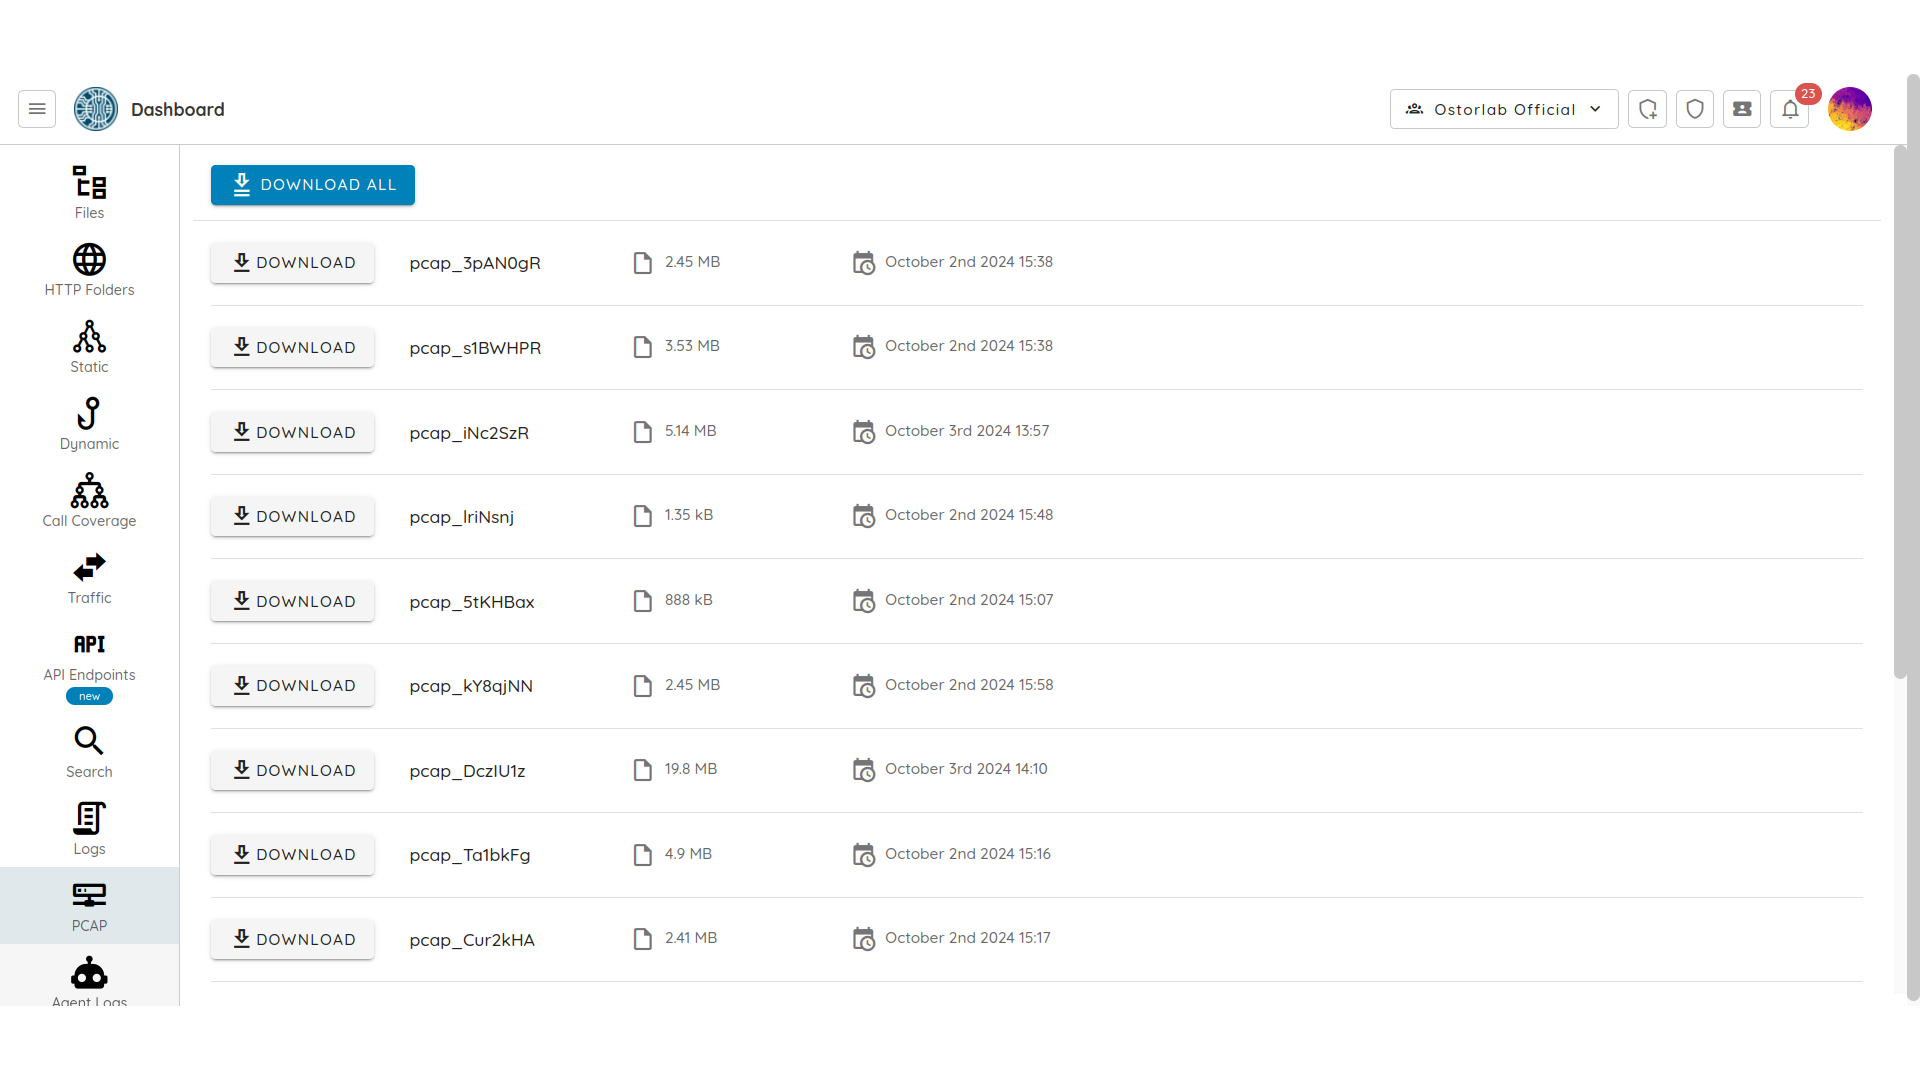
Pcap
The Pcap section provides the network traffic collected as pcap files to be downloaded for further examination.
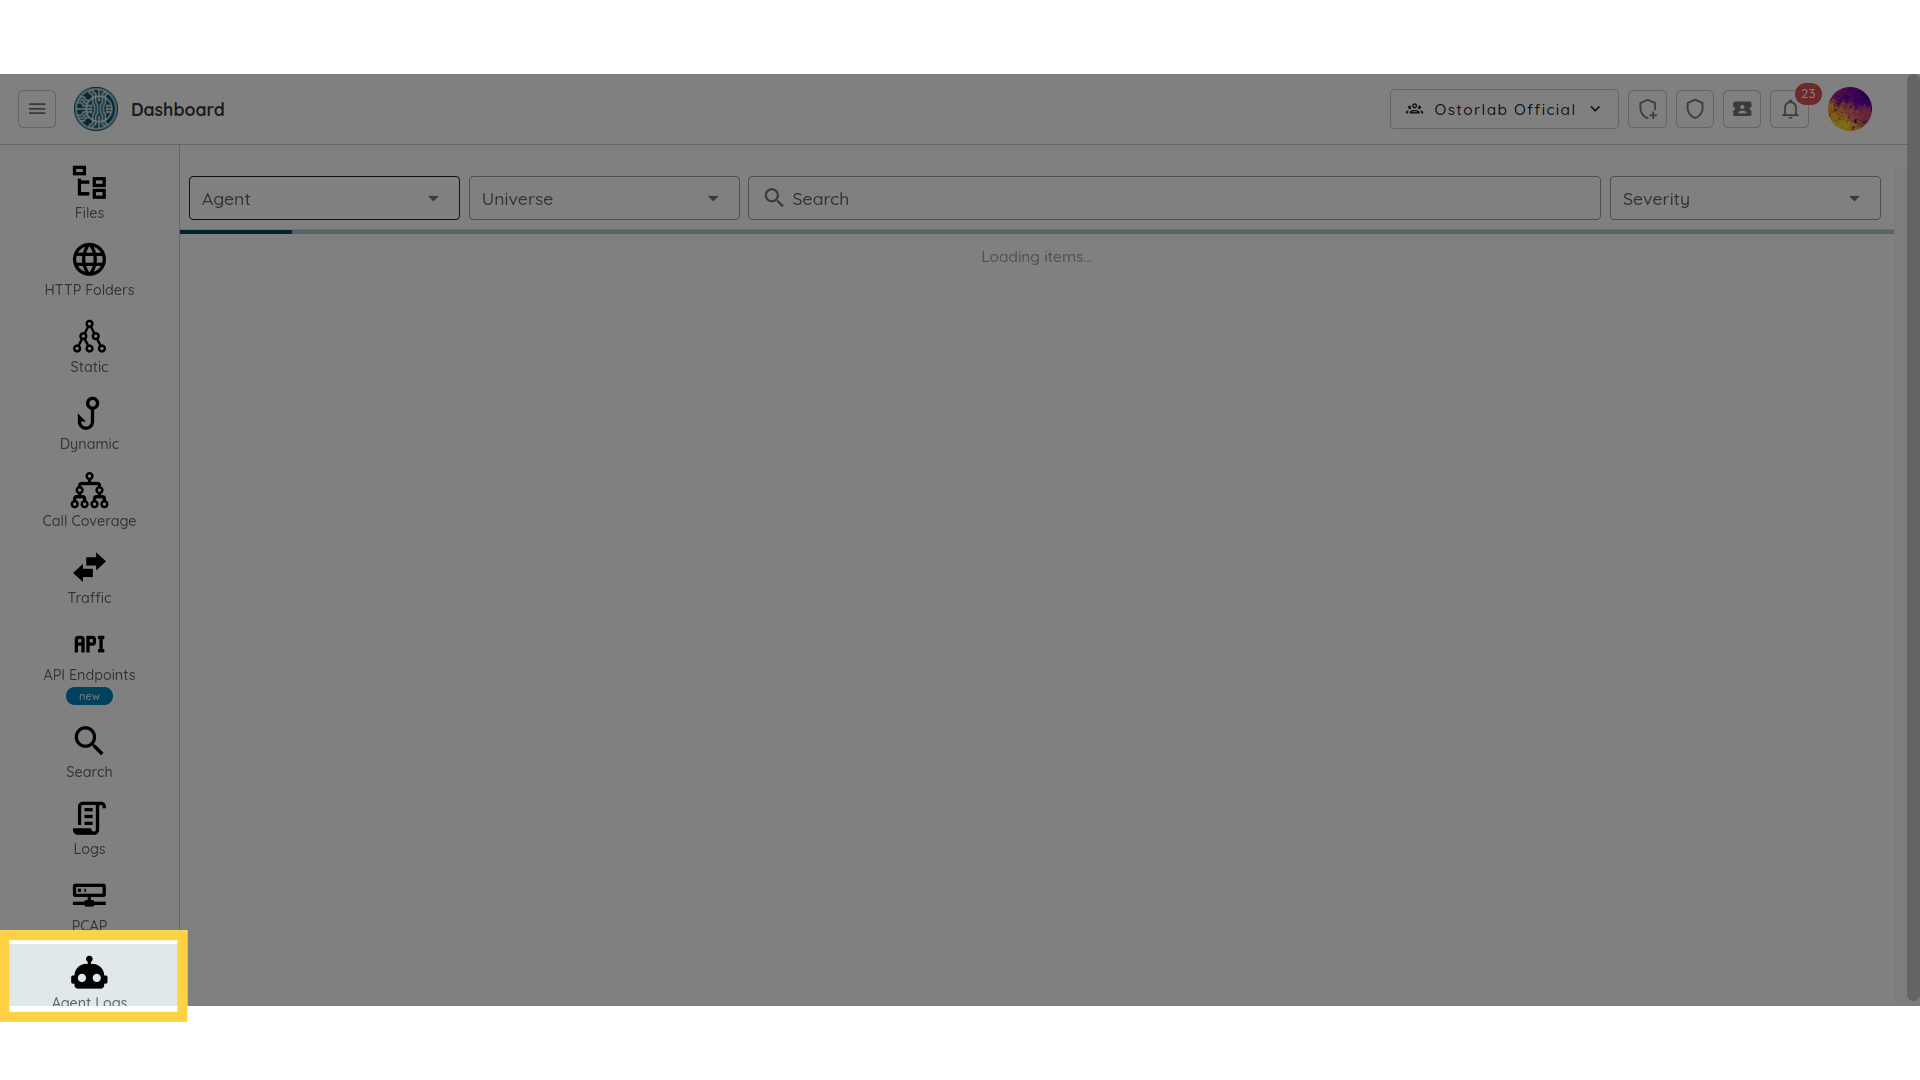
Agent Logs
The agent logs section provides access to the logs of any custom agent that you might have implemented.
Vulnerabilities
The Vulnerabilities option redirects you to the list of vulnerabilities
detected by the static and the dynamic analysis.
Each finding has: name, description, recommendation, references, technical details.