Getting started
Overview
Ostorlab is a security and privacy scanner for mobile applications, web applications, and attack surface discovery.
Three main steps
Discover and manage your infrastructure and external assets: Detect correlations and find other assets you did not even know existed.
Scan mobile, web, and network assets: Ostorlab covers Android and iOS platforms, Web and Web APIs, and network scanning. It can identify over 500 classes of vulnerabilities and 100,000 outdated, vulnerable dependencies. It uses static, dynamic and behavioral analysis to ensure high coverage of the application’s attack surface and validates findings to keep false positives low.
Remediate: All vulnerabilities get aggregated into tickets that can be assigned to developers on the platform or integrated with an internal ticketing system. You can fix the vulnerability and let Ostorlab verify and confirm the fixes.
Getting Started
-
Create an account here using your email address and password.
-
The main page is the Dashboard. It opens on the Cockpit, which shows what needs your attention today:
- Your open tickets by severity, the tickets past their remediation deadline (SLO), what changed since yesterday, and what was fixed.
- Next actions: the tickets to work on first, ranked by severity and SLO.
- Scan Activity: your latest scans.
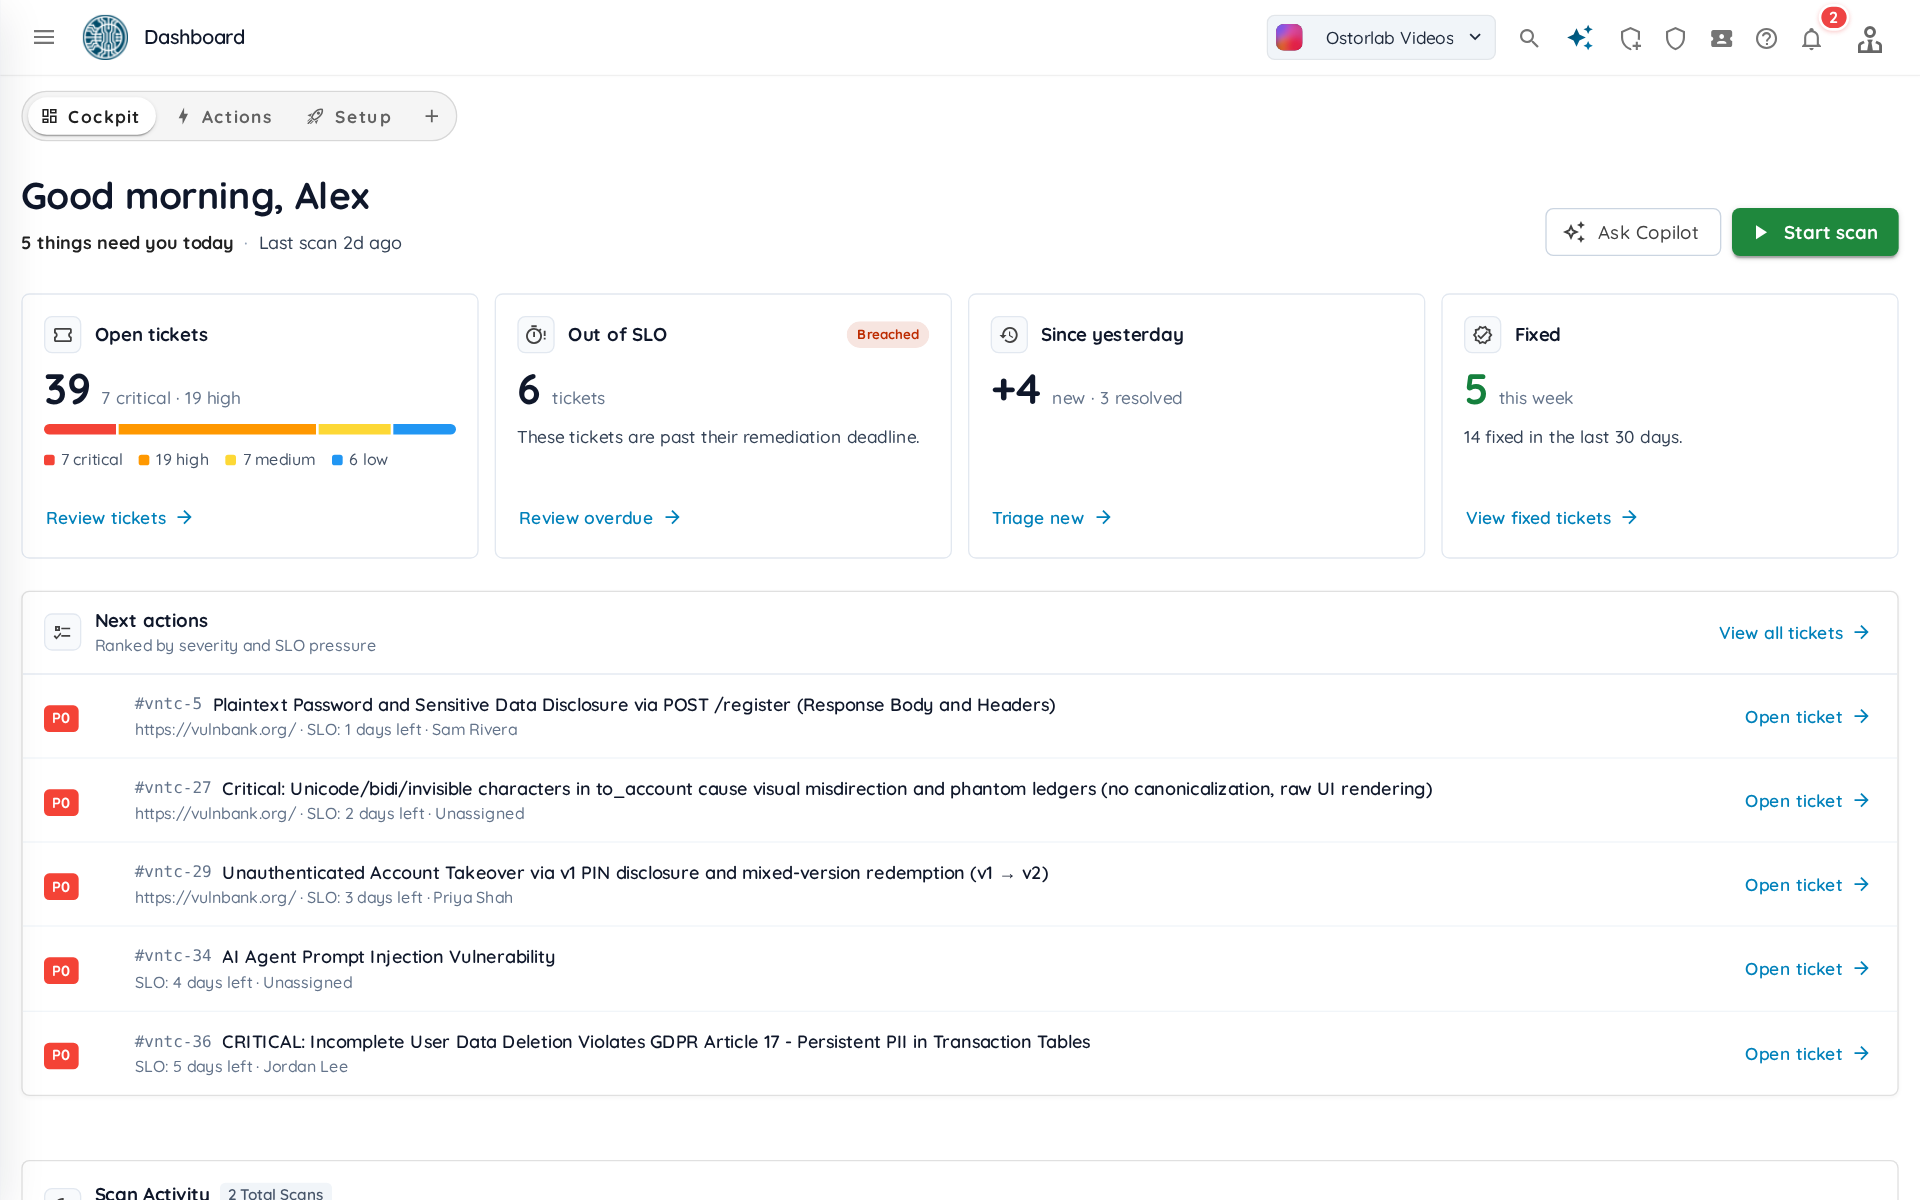
Actions lists the tickets you need to work on, Setup suggests what to set up next, and you can build your own dashboards from widgets. See Dashboard.
-
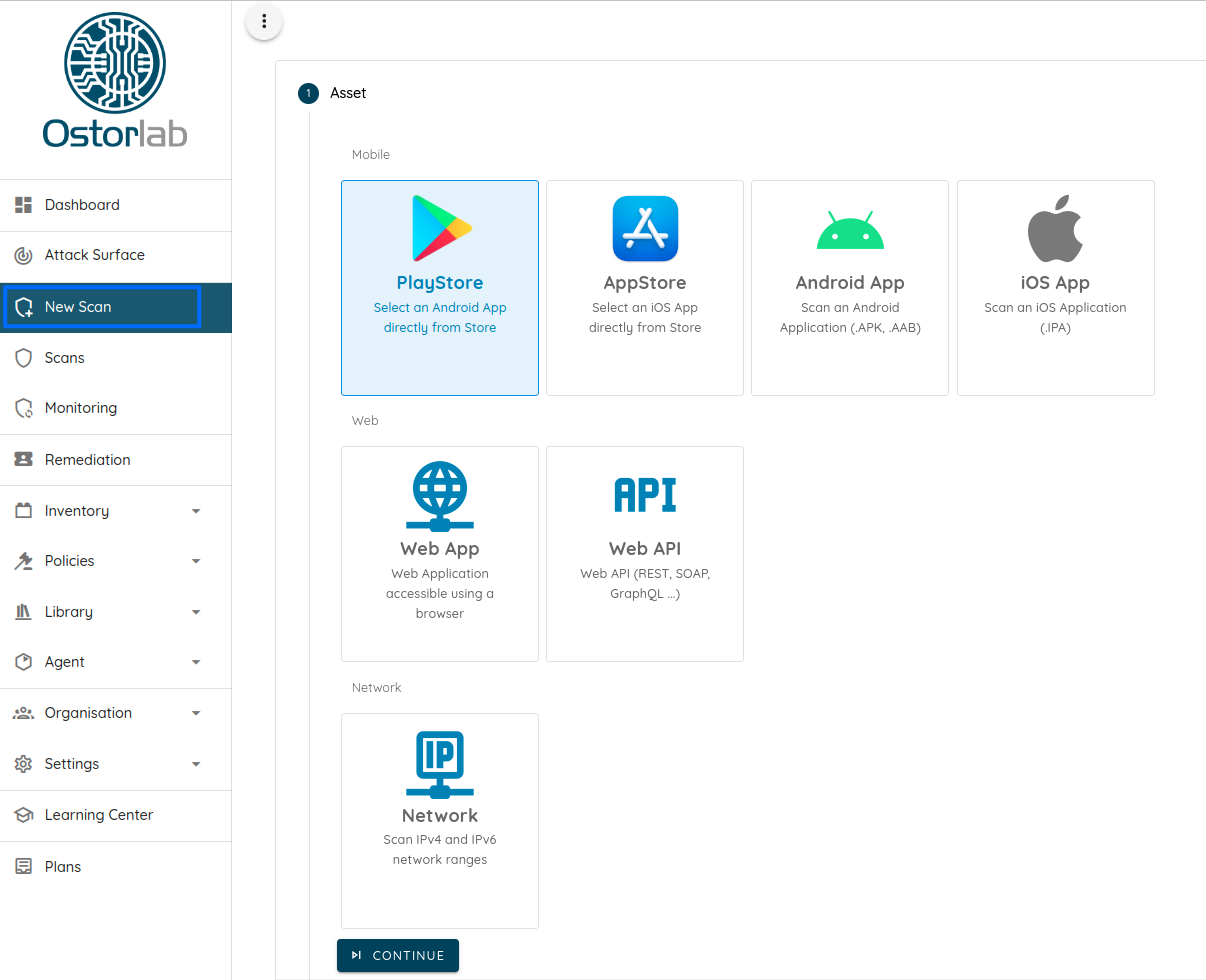
To start a scan, click New Scan in the top bar and select your asset type.
-
Select your asset by searching the store, uploading a file, or typing the URL of your web application or your public IP address.
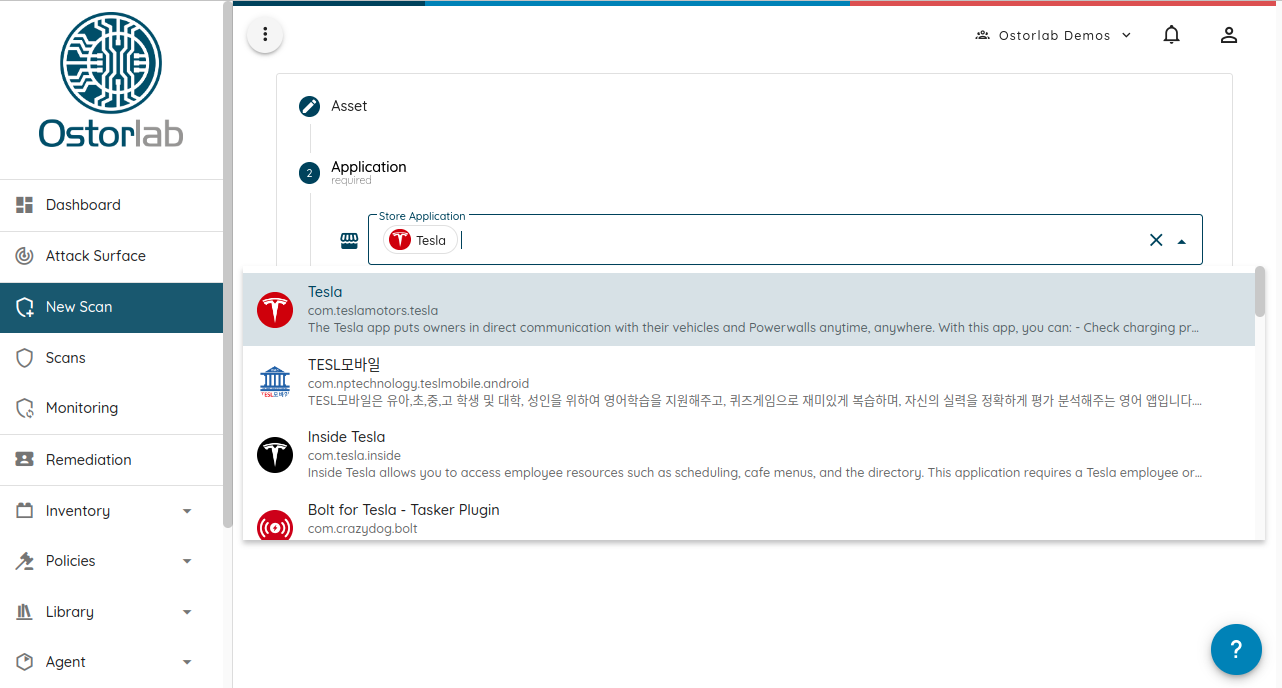
-
Select a scan profile (for example Fast Scan or Full Scan for mobile applications, or Full Web Scan for web applications), then click Start scan to create the scan. See Scan Profiles for the available profiles. The optional steps, such as Extra Context, SBOM Files and Tags, can be skipped.
-
Check your scan progress in Scans, in the top bar. A scan is first queued, then running, and then done:
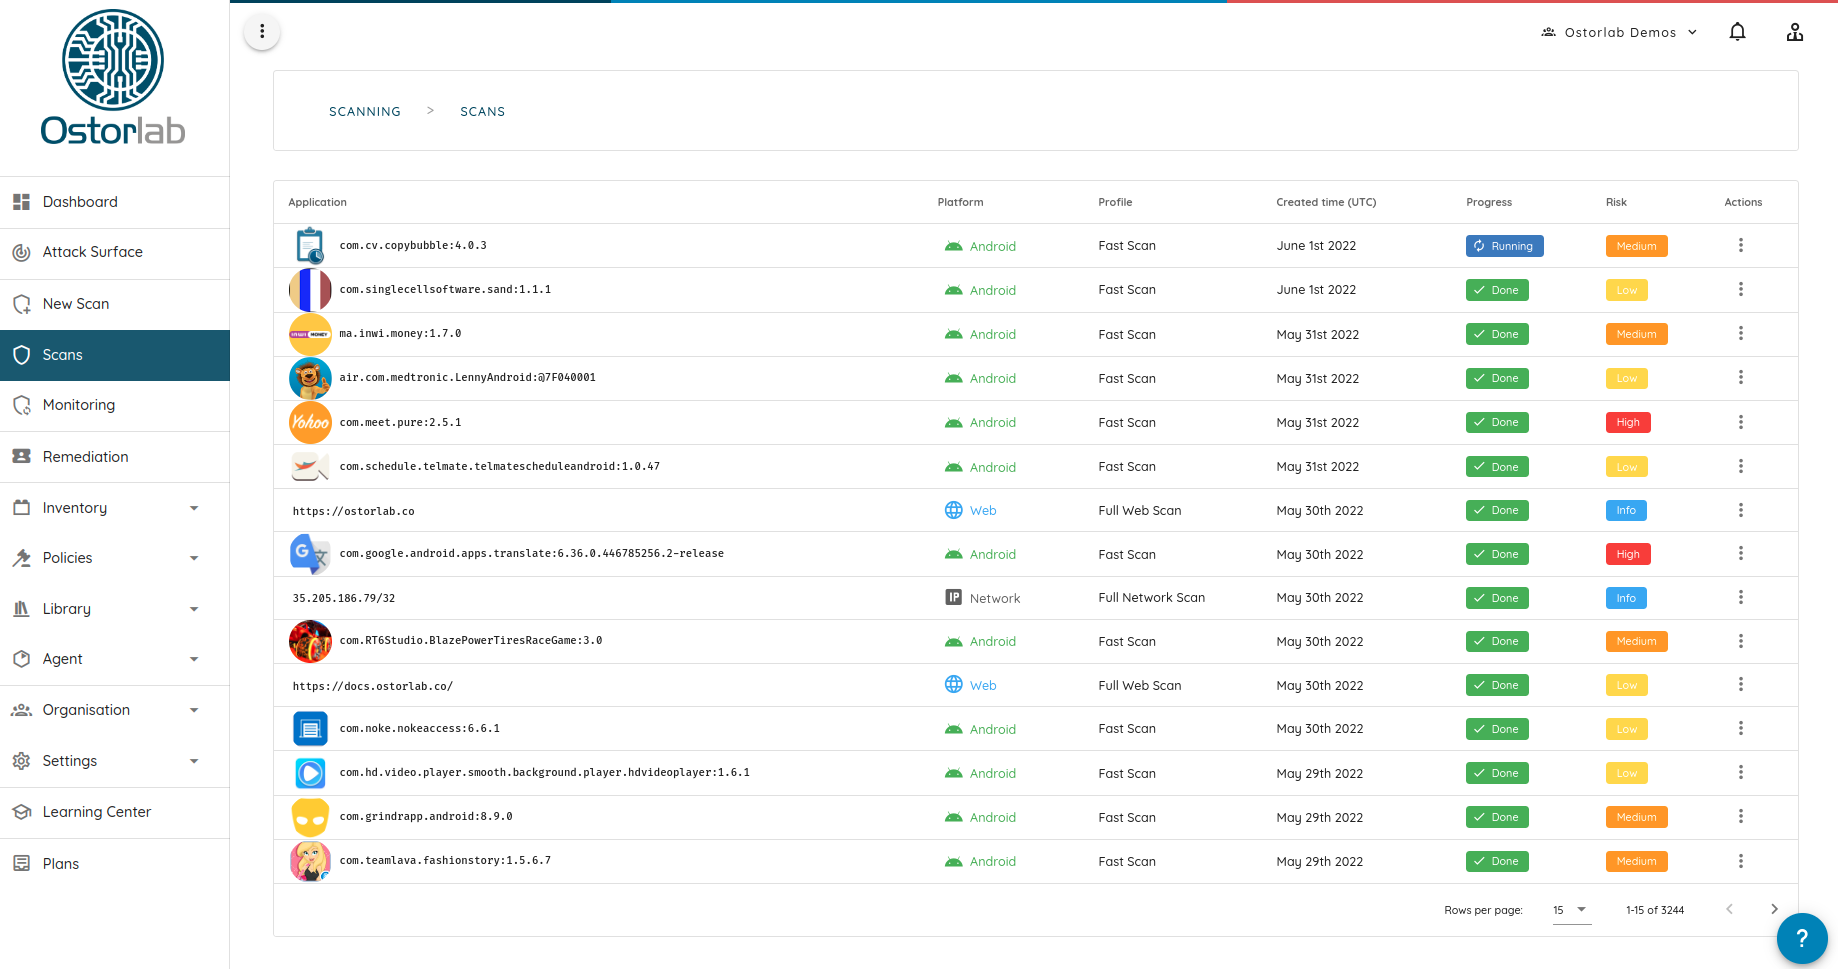
-
While the scan is running, you can already start accessing the scan results.
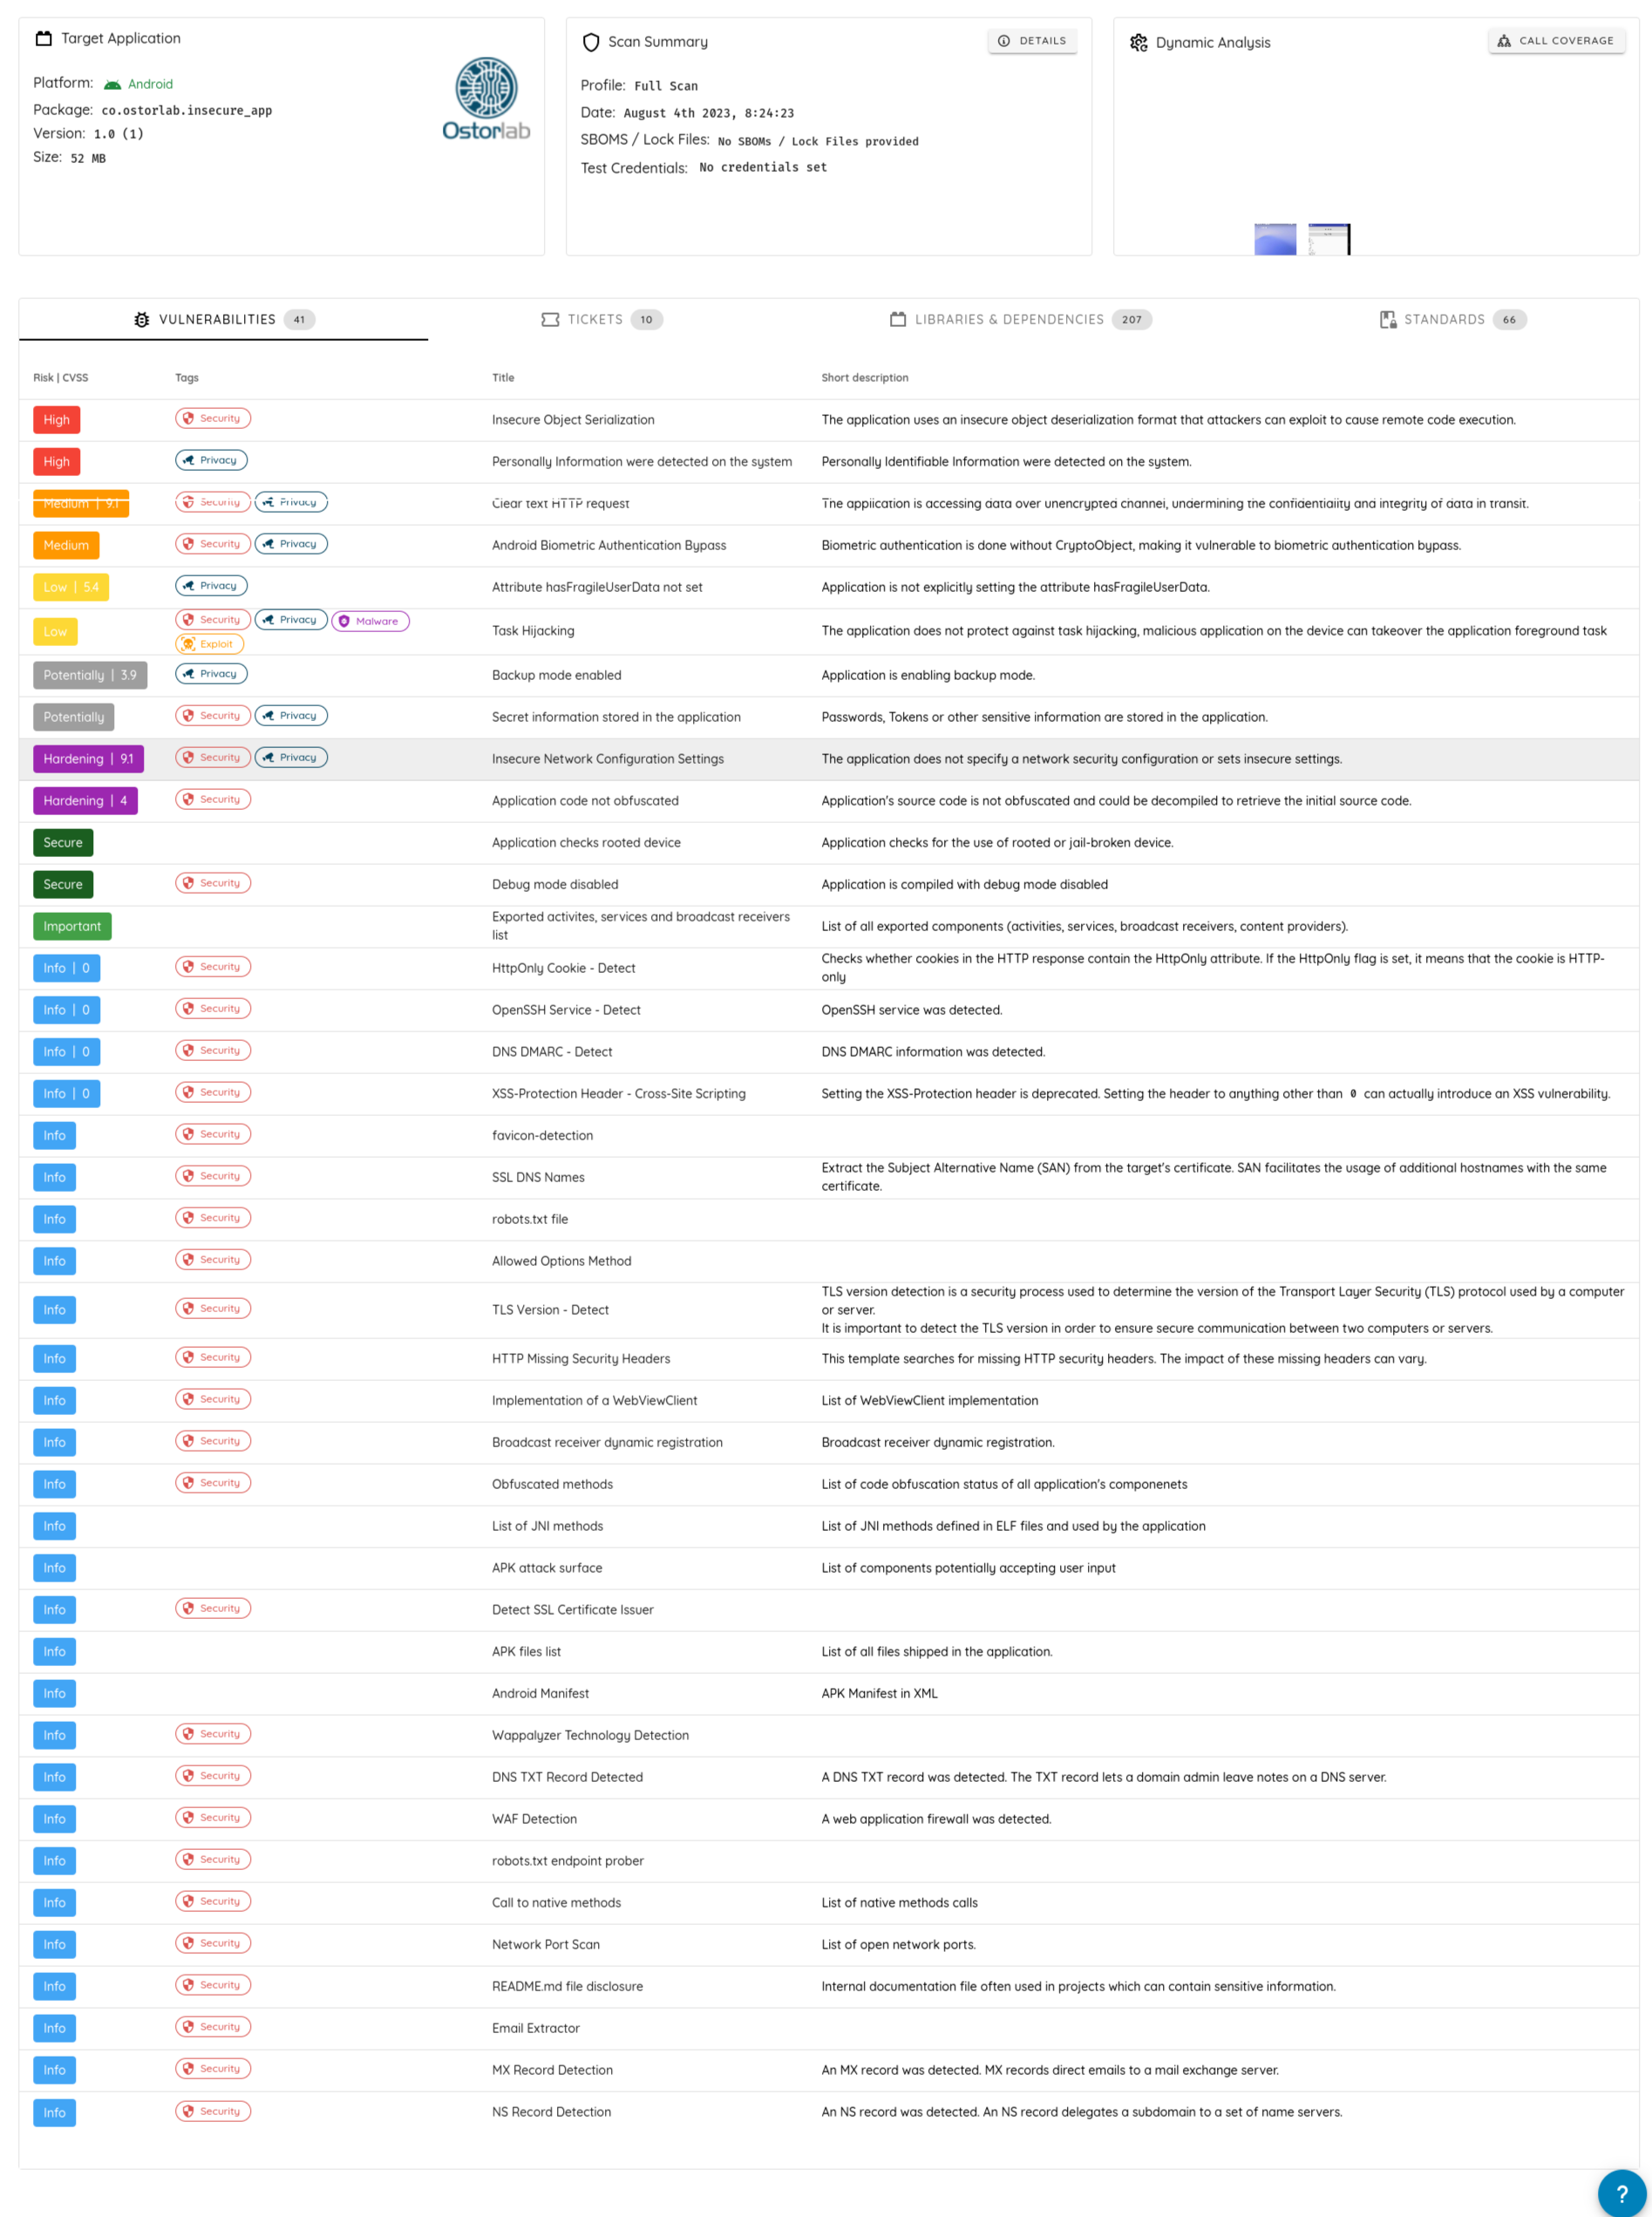
-
Click any finding to access a detailed report with recommendations, references, and technical details:
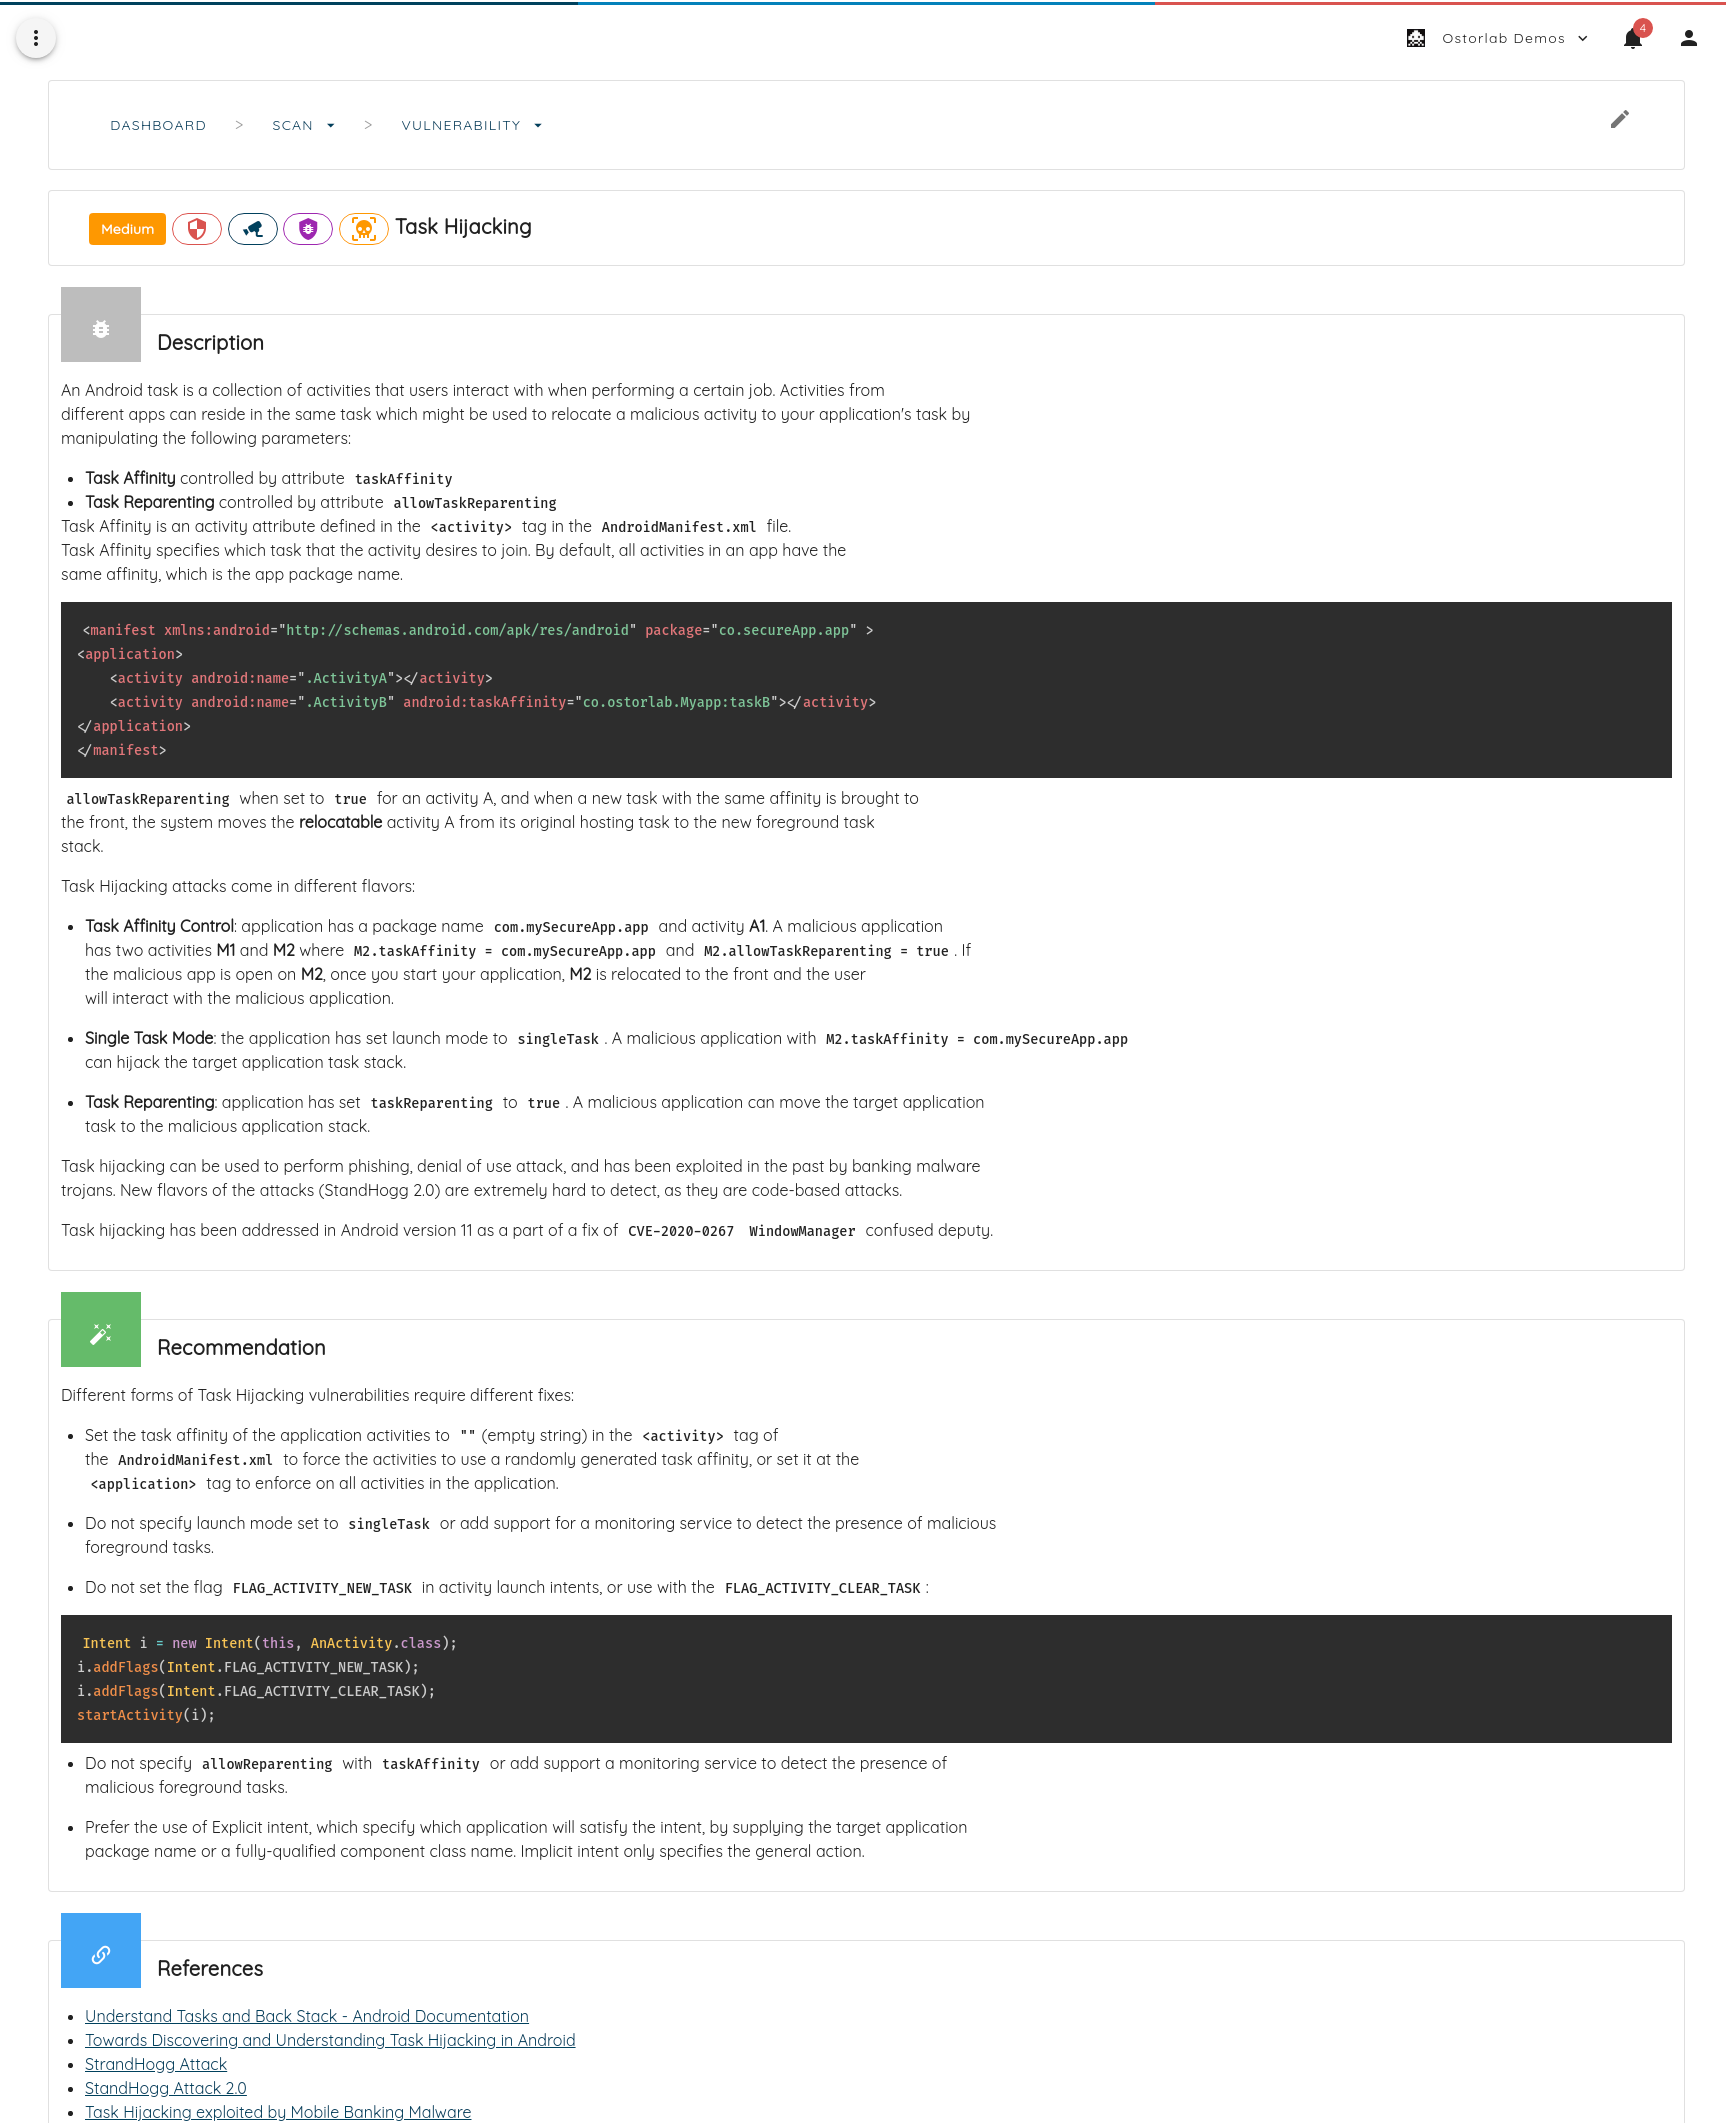
The results are grouped in the sidebar of the scan page:
- Vulnerabilities: Lists actionable findings.
- Tickets: Lists all the tickets for the scanned asset. It automatically updates the status based on the previous scan.
- Libraries & Dependencies: Lists the third-party libraries and frameworks fingerprinted in the application.
- Standards: Lists the issues found against security standards.
Agentic Deep Scans add more sections, such as Risks and Threat Intelligence.
You can also generate a PDF report from the PDF menu. The PDF generation runs in the background, and you receive a notification once the report is ready.

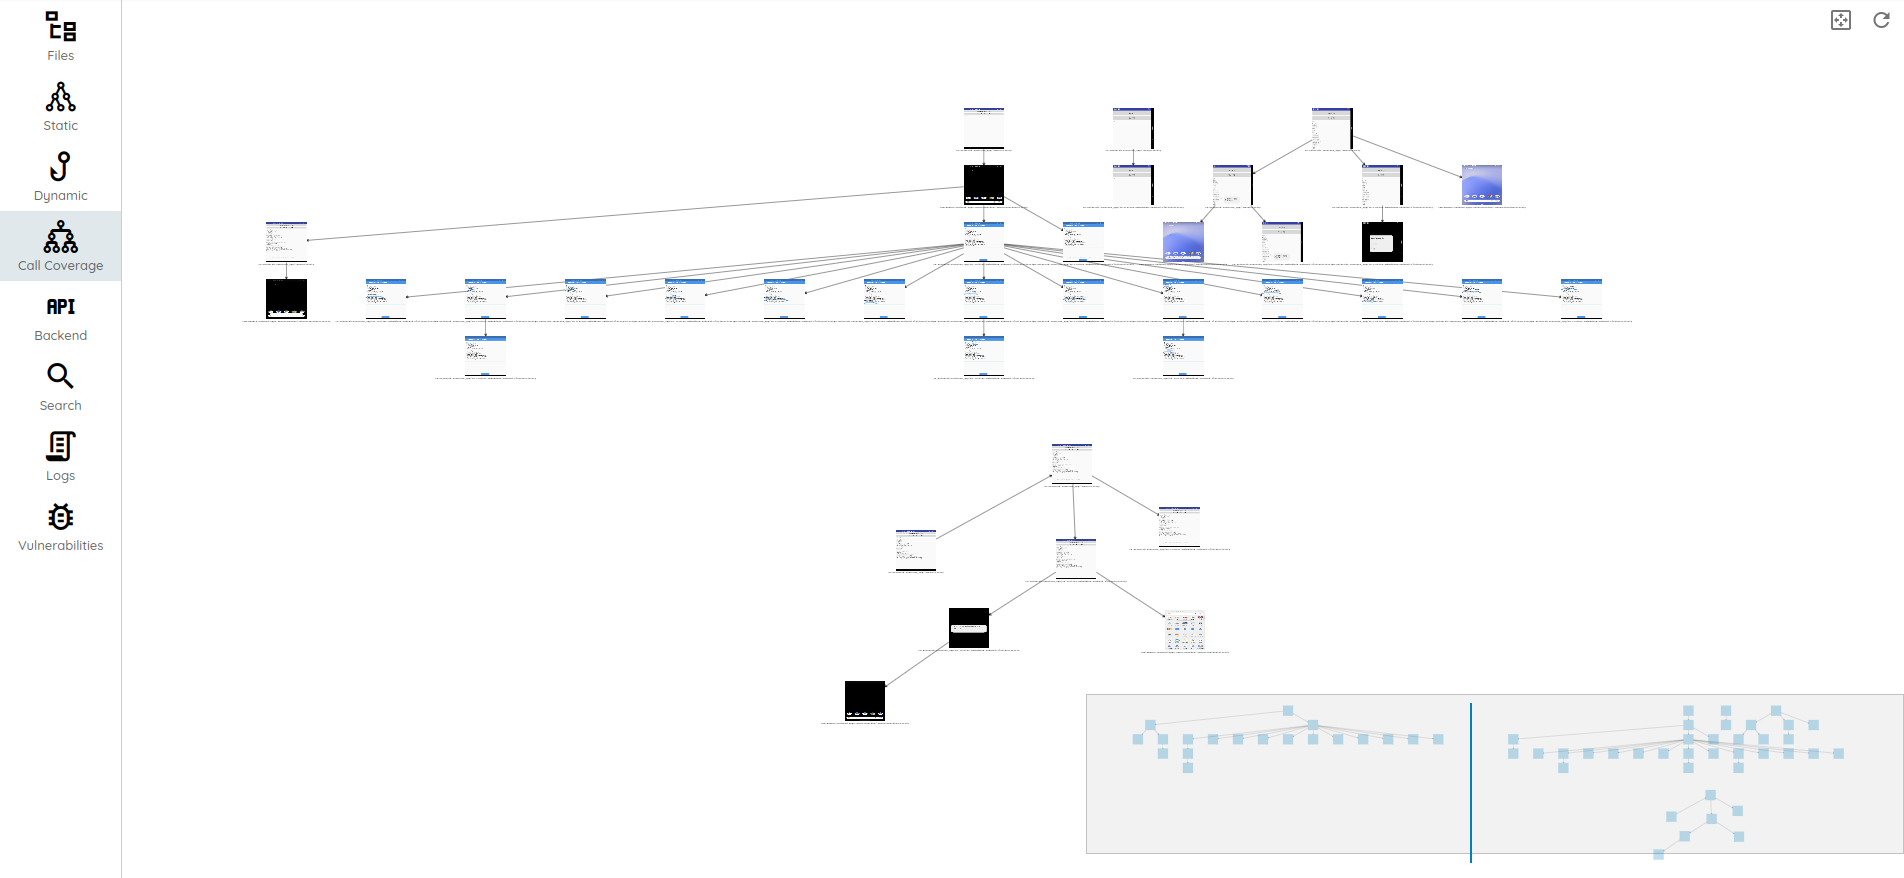
All scans produce a set of artifacts that varies depending on the type of the scan. For a mobile application, click Call Coverage under Dynamic Analysis on the scan page to open them.