Scans & Risk
The Scans & Risk widgets show your scan and vulnerability metrics. Add them to a dashboard from the Scans & Risk category of the widget catalog: see Custom dashboards.
Vulnerabilities by Risk
Vulnerabilities are grouped by risk rating to allow you to see the changes in the number of vulnerabilities on a daily basis. So, it answers the question: Are you improving or not?

Most common vulnerabilities
These metrics show you the most common vulnerabilities from all your scans and how many times each vulnerability was detected.

Scan Distribution by Scan Profile
These metrics tell you how many scans were created with a particular scan profile, each day.

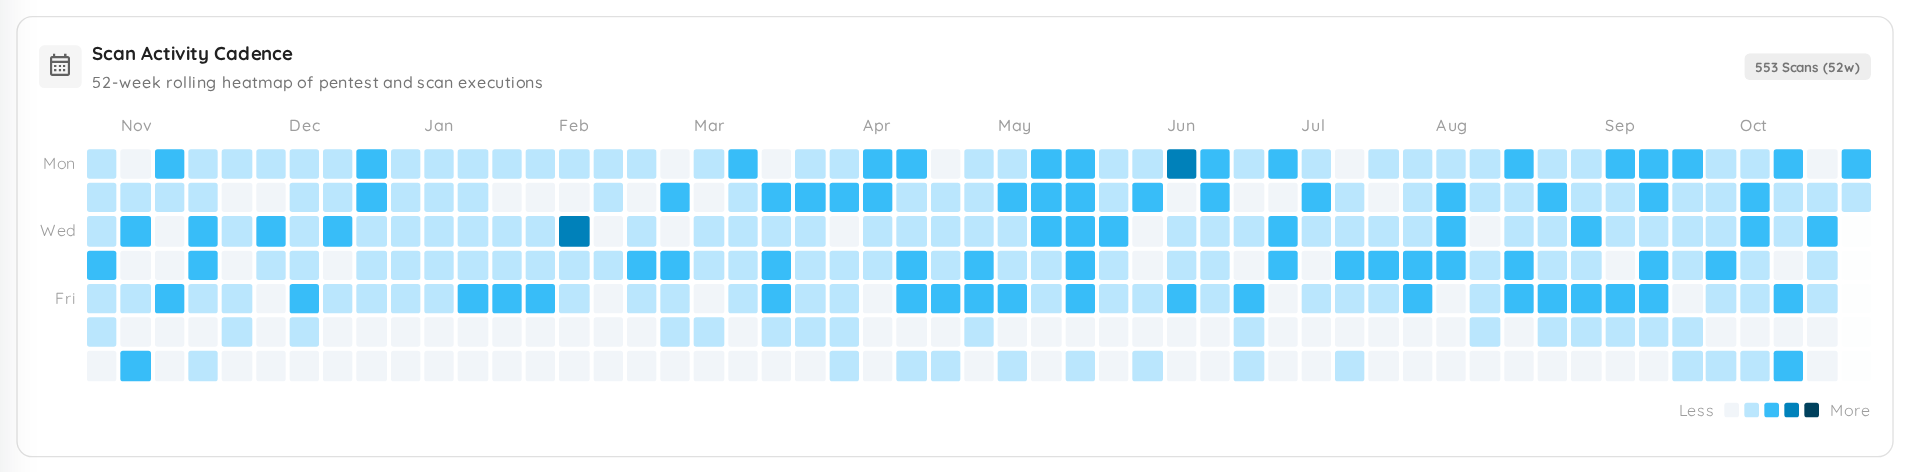
Scan Activity Cadence
The scan activity cadence is a 52-week heatmap of how many scans ran each day. Scan frequency is important if you must adhere to compliance requirements like PCI, FedRAMP or HIPAA.