Remediation
The Remediation section of the dashboard groups all ticket related metrics.
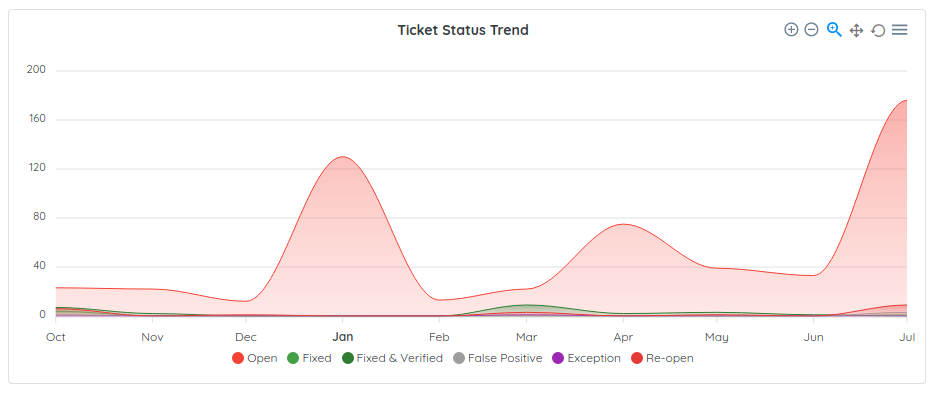
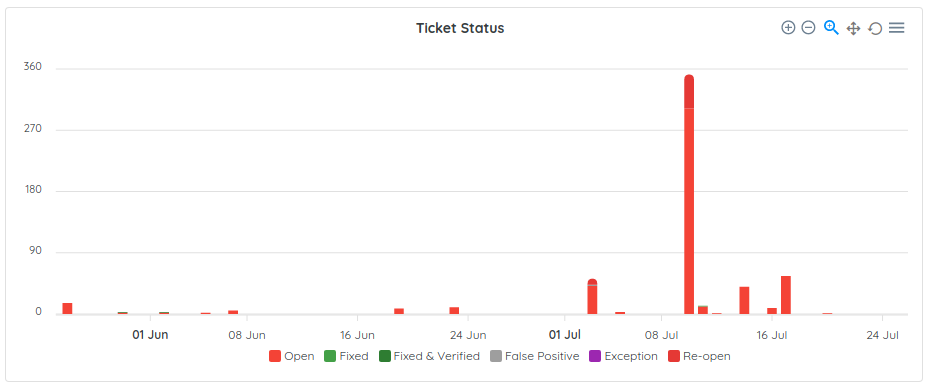
Ticket Status Trends
Ticket status trends are monthly and daily metrics showing changes in how many tickets are opened, re-opened, fixed, verified or marked as a false-positive or exceptions. This metric can reflect the velocity of your team at handling and fixing bugs.
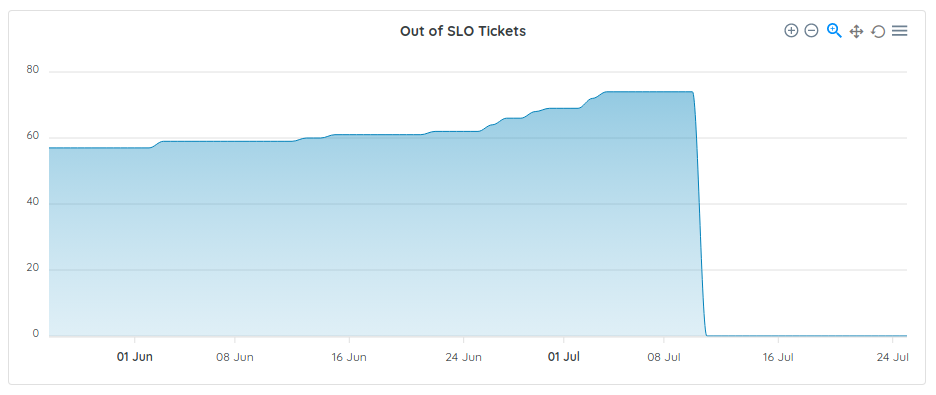
Out-of-slo ticket
The out-of-slo metric shows how many tickets do not respect your configured patching policy. Ostorlab allows you to define your patching policy by risk rating or ticket priority. This metric either shows an inadequate patching policy or the need for more resources to address the volume and urgency of identified vulnerabilities.
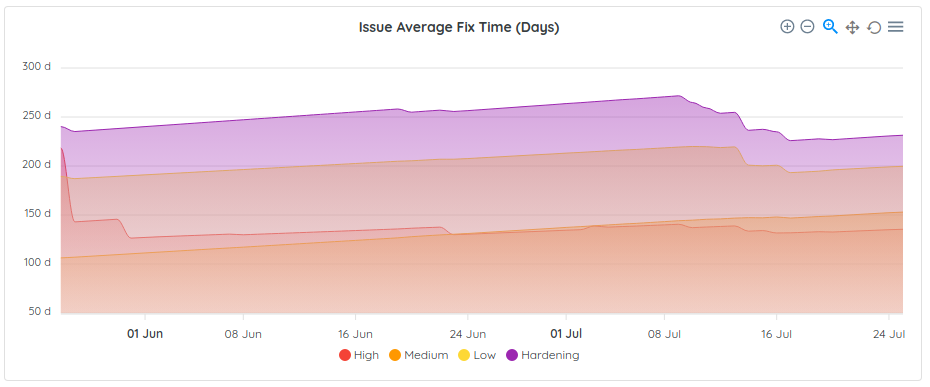
Issue Average Fix Time (Days)
The Issue Average Fix Time metric shows how many tickets are fixed per risk rating.
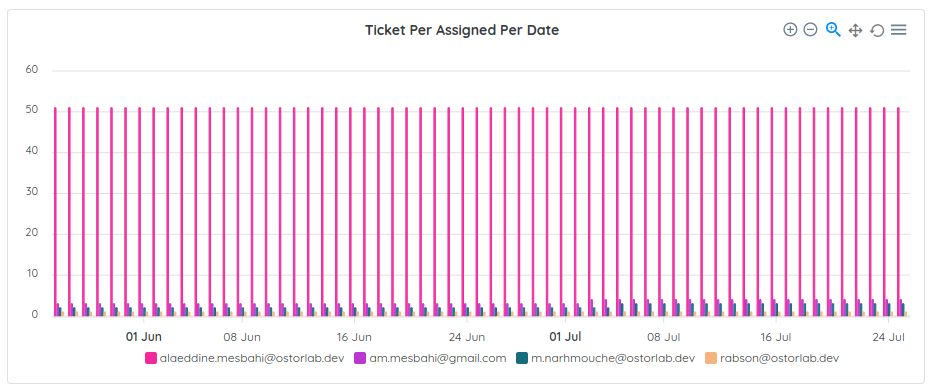
Ticket Per Assigned Per Date
These metrics show the number of tickets assigned to each user per date.
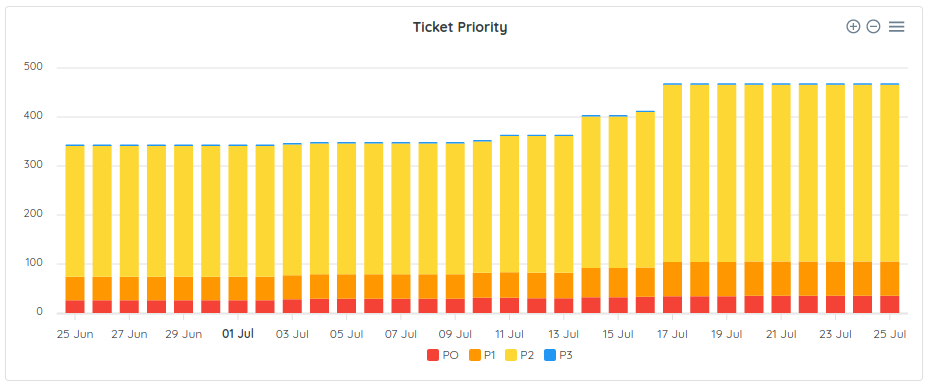
Ticket Priority
These metrics show the number of pending tickets on a daily basis.