Dashboard
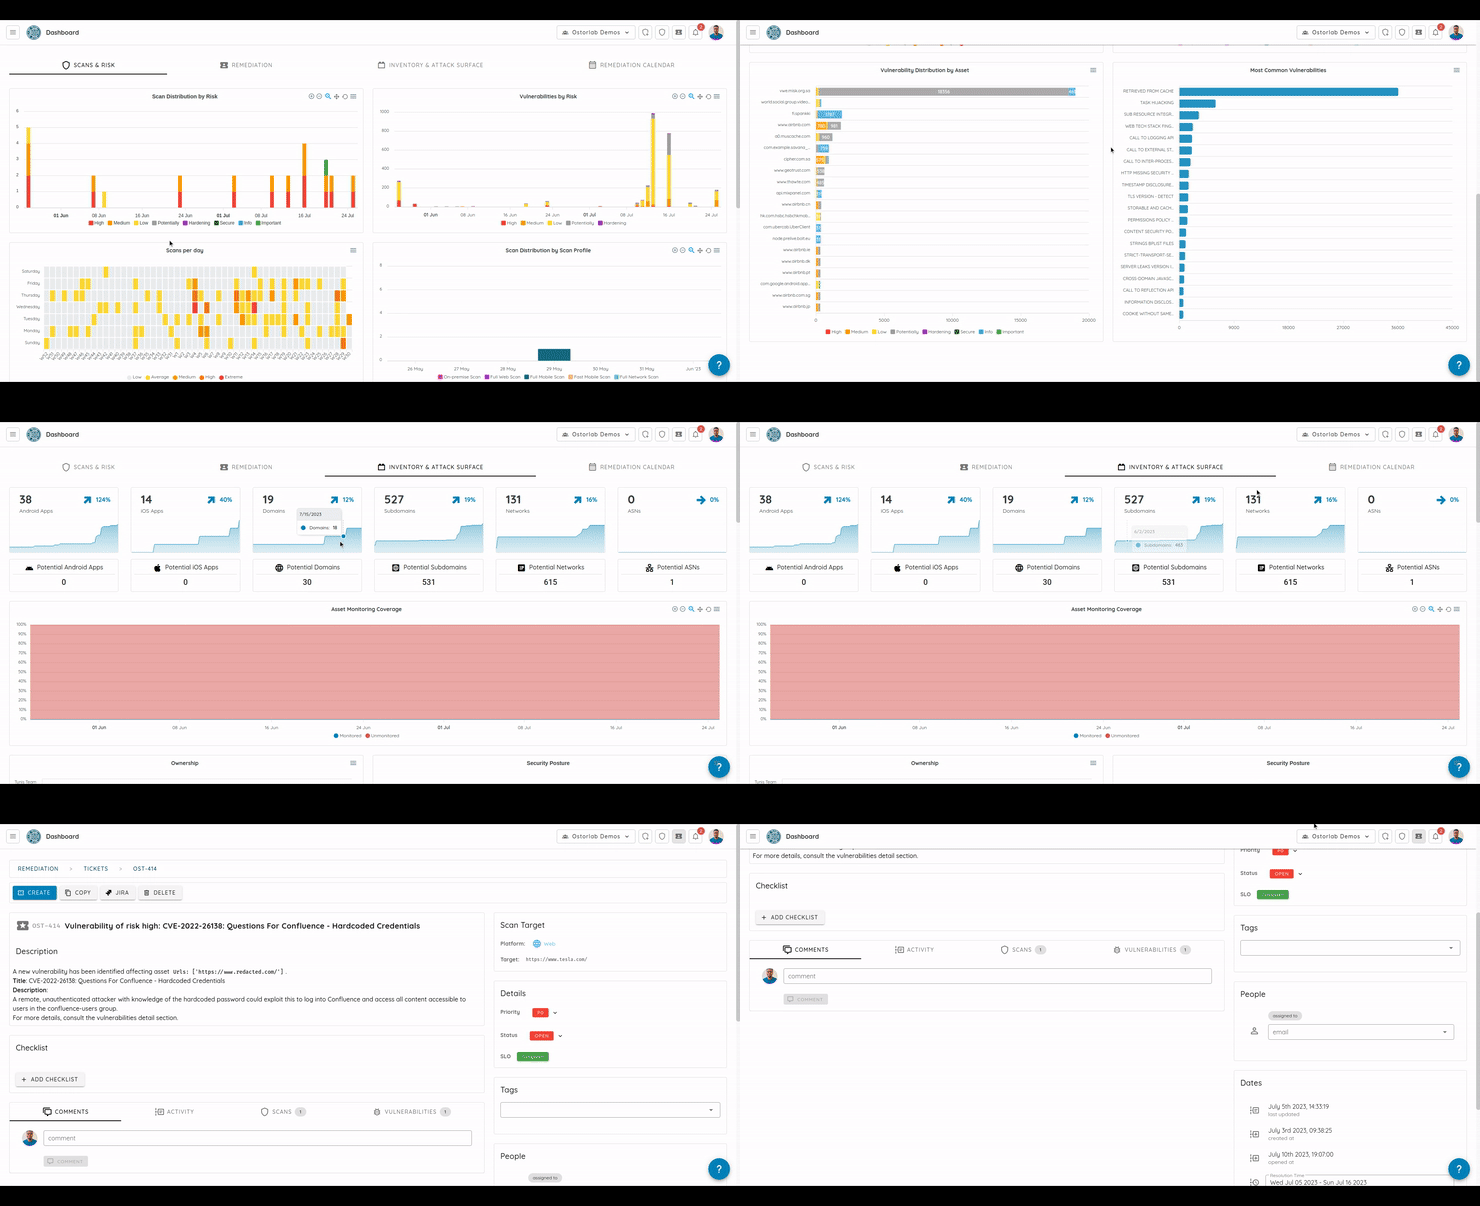
The dashboard is a powerful way to present data about your risk, inventory, and remediation efforts. It is designed to showcase data in a quick, easy-to-grasp format with the most relevant information understandable at a glance.

The dashboard allows you to answer questions like:
- What is the size of my infrastructure?
- How many potential assets are detected that require my attention?
- What is my monitoring coverage?
- What is the distribution of my assets by owner?
- What is the distribution of my assets by logical location?
- How do I compare against other organizations?
- What are my most common tech stacks and most common exposed services?
- Where are my assets located geographically?
- What are my most vulnerable assets?
- What are the most common vulnerability classes I am seeing?
- How far am I lagging behind in vulnerability fixes?
- How often do I stick with a scan schedule?
- Who is fixing most issues in my team / organization?
The dashboard is categorized into three sections namely Scan & Risk, Remediation, Inventory & Attack Surface, and Remediation Calendar.
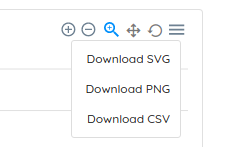
All metrics have a download button to access the data as a PNG, SVG or CSV file and to navigate data:
